Showing posts with label ECS. Show all posts

Thursday, October 31, 2019

Way Worse


Climate Change is Worse Than We've Been ToldJay Greathouse. Oct. 13, 2019.

IPCC recommendations understate our current situation and underestimate our near-future risks by relying on the outdated 1979 “Charney Sensitivity” of the IPCC computer model ensemble. This sensitivity value of the surface temperature of the planet to the amount of CO2 in the atmosphere, always challenged by other models, merely seems the one most acceptable to the conservative IPCC consensus policy process.

In this case we are talking about the sensitivity value of the surface temperature of the planet to double the amount of CO2 in the atmosphere. A low value suggests that we can keep on with business as usual burning fossil fuels for awhile longer. A high value suggests that we need to stop now and indicates how much trouble we’re in already.

The differences between the sensitivity values given by the models, it seems, concerns how well the various models account for the numerous and complex feedbacks. All the models seem to miss some of the feedbacks, as to be expected since no model can totally represent the total reality. The valid proof of any computer model can only be confirmation from the observation of reality.

To understand the implications of the IPCC preferring a certain model, we can compare three of the more famous models. The observable reality against which modeled values can be checked is the change in average surface temperature of the planet between the last glacial maximum and the preindustrial benchmark.

This temperature change between the last glacial maximum and the preindustrial benchmark is assumed to be about 5°C, during which time the CO2 levels went from around 180 ppm to 280 ppm. These are the more conservative numbers produced from fossilized vegetation and early ice core samples. These numbers were later confirmed in other ways and I’ll get to that.

Then, we can compare the three models in a chart showing how they stack up to reality. The first model is named after Jule G. Charney. The second model is named after the Hadley Centre of the UK Meteorological Office. The third model is named after James Hansen, who had previously worked with Charney on the first model.


Jule G. Charney was Chairman of the Ad Hoc Study Group on Carbon Dioxide and Climate that produced the “Caron Dioxide and Climate: A Scientific Assessment”. It’s pretty easy to do a simple search and still find a copy of the “charney_report1979.pdf” online.

The New York Times published a good article about this called “Losing Earth: The Decade We Almost Stopped Climate Change”.  It’s worth taking the time to read it. This article was later expanded into a book.

The Charney Sensitivity only included some of the relatively fast feedbacks in terms of water-vapor concentration, some albedo change from reduced sea ice coverage, together with estimates of changes in cloud effects. This was the best computers could do in 1979 and they knew then that they had not included all of the feedbacks.

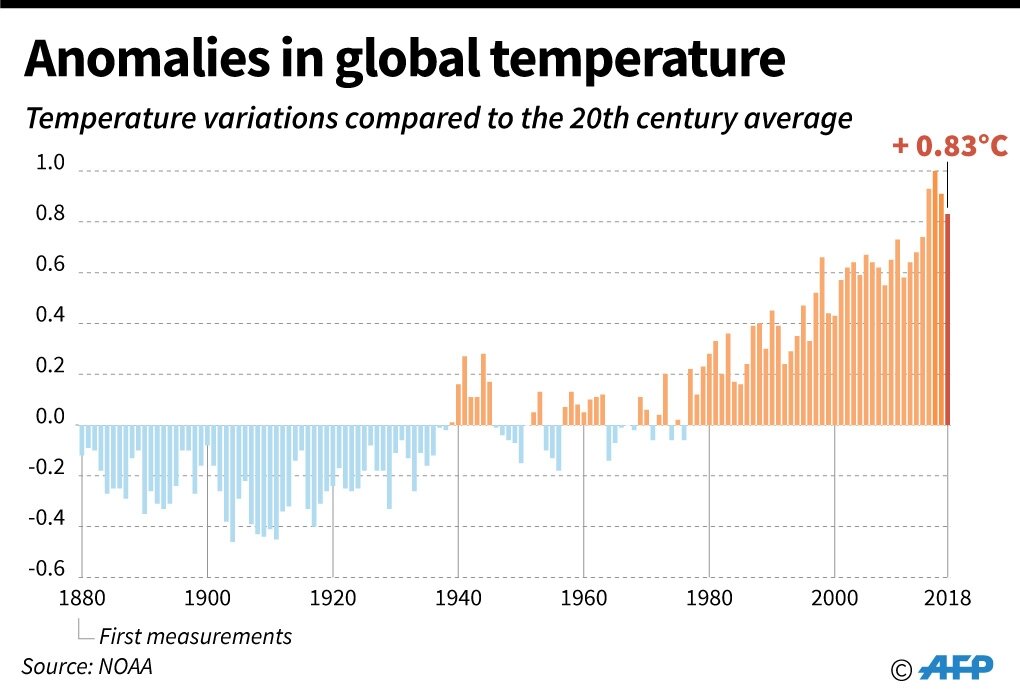
The Charney Sensitivity indicates about 3°C warming for a doubling of CO2. As you can see from the chart, it shows we can expect about 1.5°C warming from our current level of CO2. At 440 ppm CO2 we should expect about 2°C warming from CO2 alone. We haven’t experienced all that heat yet because Earth’s thermal inertia delays Earth’s thermal equilibrium with the GHG (greenhouse gas) already in the atmosphere.

The thermal inertia of the global system is confirmed by the time-lag between cause and effect, between the human use of fossil fuels and the full manifestation of global heating and climate change. The Earth has yet to reach thermal equilibrium with the total amount of both CO2 and non-CO2 GHG already in the atmosphere.

It’s as if the Earth is a huge pot of water on a small stove and we have the heat turned very low. It will just take some time for the heat to equally warm up the Earth. And, of course, the heat is still turned on, so we know it will eventually get much hotter because we are still pumping more GHG into the atmosphere.

It’s just that there was never a time in Earth’s natural history that so much GHG has been added to the atmosphere is such a short time period. What we’ve done in a little over a couple of hundred of years it took Earth thousands of years to accomplish previous to the past extinction events.

Starting in 2000 with more powerful computers, the Hadley Centre of the UK Meteorological Office appeared to lead the field with their evolving HadGen3 programs. They were able to include the so-called carbon cycle feedbacks from things like vegetation changes.

The Hadley Sensitivity indicated about 4.5°C warming for a doubling of CO2. With this sensitivity we can expect about 2.25°C of warming from our current level of CO2. At 440 ppm CO2 we should expect about 3°C warming from CO2 alone. That would be hot enough to to end people, that is human extinction.

In 2005, Ferdinand Engelbeen published results of a regression analysis of the correlated values of CO2 concentration and temperature based on the gas analysis of bubbles trapped deep in the Antarctic ice cap at Vostok. This work confirmed the earlier number of about 5°C temperature rise when the CO2 levels went from around 180 ppm to 280 ppm. I told you this was coming.

In 2008 James Hansen and associates attempted to close the gap between computer modeling and the empirical measurement from Vostok. Now this model also included the slow feedbacks from things like ice sheet loss.

The Hansen Sensitivity indicated about 6°C warming for a doubling of CO2. With this sensitivity we can expect, eventually, about 3°C of warming from our current level of CO2. With this added accuracy we see that people are already functionally extinct. At 440 ppm CO2 we should expect almost 4°C warming from CO2 alone.

Then scientists working in the field came up with more confirmation of the earlier numbers derived from real world evidence. Towards the end of 2009, Mark Pagani and associates published a paper on “High Earth-system climate sensitivity determined from Piocene carbon dioxide concentration”. Their analysis was based on proxy derivation of temperature and CO2 concentration using ocean-floor sediment cores reaching back some 60 to 100 million years.

In 2011, Jeffrey Kiehl surveyed current peer-reviewed academic papers reporting on the reconstruction of values of atmospheric CO2 concentration reaching back to the Eocene period. The authors also derived values for earth system climate sensitivity across this period. Kiehl’s work confirmed Pagani’s, Engelbeen’s and the previous paleo-vegetation estimates.

We now have excellent numbers for a total Earth System Sensitivity derived from actual measurements, not just computer models. 

The Earth System Sensitivity indicates almost 8°C warming for a doubling of CO2. With this sensitivity we can expect about 4°C of warming from our current level of CO2. At 440 ppm CO2 we should expect about 5°C warming from CO2 alone. That is warm enough to end all life on Earth.

Today we have more than just CO2 in the atmosphere. We also have a lot of methane in the atmosphere, which is a lot more warming than CO2. The question of how much more warming depends upon what time period you look at because methane breaks down to CO2 over time.


The carbon majors like using the number for methane’s warming ability of 34 times that of CO2 over a hundred years time. Over a shorter period of time, say 20 years, methane’s warming ability is about 86 times that of CO2. Methane is also measured in ppb, 1/1000 the ppm concentration that’s used for measuring CO2, so there is a bit of math involved to determine its CO2 equivalence.

As the planet heats up another powerful GHG, water vapor, levels also go up because of increased evaporation. The evidence of this increased level of evaporation shows up in extreme weather events including more flooding from heavier rainfall and greater droughts.

Methane in the atmosphere also increases the level of ozone in the atmosphere, another powerful GHG. Then we have nitrous oxide levels to account for, which is another powerful GHG. Altogether, to say that we now have about about 700 parts per million CO2e in the atmosphere is a totally reasonable estimate.


At 700 parts per million CO2e in the atmosphere we already have more than a 10°C temperature rise in the pipeline. Even if we just stop all trains, planes and automobiles plus stop all fossil fuel electricity generation and petrol-chemical production, we’d still have to stop all the leaks from our natural gas wells and pipelines.

Don’t forget the methane bubbling up from the East Siberian Arctic Shelf and the East Siberian Sea and the GHG from the thawing permafrost tundra. Now those GHG emissions are on their own being run by natural reactions to an already too warm planet. If we can’t do something about that, then we are in run-a-way global heating.

We don’t have any carbon budget left

[Only] with immediate carbon drawdown and sequestration to 280 ppm to refreeze the Arctic, we can save life on Earth.

Sunday, September 29, 2019

Earth warming more quickly than thought

Earth warming more quickly than thought, new climate models show. Marlowe Hood, Phys.org. Sep. 17, 2019.

By 2100, average temperatures could rise 6.5 to 7.0 degrees Celsius above pre-industrial levels if carbon emissions continue unabated, separate models from two leading research centres in France showed


Greenhouse gases thrust into the atmosphere mainly by burning fossil fuels are warming Earth's surface more quickly than previously understood, according to new climate models set to replace those used in current UN projections, scientists said Tuesday.

By 2100, average temperatures could rise 7.0 degrees Celsius above pre-industrial levels if carbon emissions continue unabated, separate models from two leading research centres in France showed.

That is up to two degrees higher than the equivalent scenario in the Intergovernmental Panel for Climate Change's (IPCC) 2014 benchmark 5th Assessment Report.

The new calculations also suggest that the Paris Agreement goals of capping global warming at "well below" two degrees, and 1.5C if possible, will be challenging at best, the scientists said.

"With our two models, we see that the scenario known as SSP1 2.6—which normally allows us to stay under 2C—doesn't quite get us there," Olivier Boucher, head of the Institute Pierre Simon Laplace Climate Modelling Centre in Paris, told AFP.

With only one degree Celsius of warming so far, the world is coping with increasingly deadly heat waves, droughts, floods and tropical cyclones made more destructive by rising seas.

A new generation of 30-odd climate models known collectively as CMIP6—including the two unveiled Tuesday—will underpin the IPCC's next major report in 2021.


Variations in temperature by year compared to the 20th century average.

"CMIP6 clearly includes the latest modelling improvements," even as important uncertainties remain, Joeri Rogelj, an associate professor at Imperial College London and an IPCC lead author, told AFP.

These include increased supercomputing power and sharper representations of weather systems, natural and man-made particles, and how clouds evolve in a warming world.

"We have better models now," said Boucher. "They have better resolution, and they represent current climate trends more accurately."

'Tipping points'

A core finding of the new models is that increased levels of CO2 in the atmosphere will warm Earth's surface more—and more easily—than earlier calculations had suggested.

If confirmed, this higher "equilibrium climate sensitivity", or ECS, means humanity's carbon budget—our total emissions allowance—is likely to shrink.


The French models are the first to be released.

"The French modelling groups are to be congratulated for being the first to complete their simulations," said Piers Forster, director of the Priestley International Centre for Climate at the University of Leeds.

But other models developed independently have come to the same unsettling conclusion, Boucher confirmed.

"The most respected ones—from the United States, and Britain's Met Office—also show a higher ECS" than the previous generation of models, he said.

This is bad news for the fight against global warming, which continues to face strong political headwinds and institutional inertia despite a rapid crescendo of public awareness and concern.

"A higher ECS means a greater likelihood of reaching higher levels of global warming, even with deeper emissions cuts," Boucher and two British scientists—Stephen Belcher from the UK Met Office and Rowan Sutton from the UK National Centre for Atmospheric Science—wrote in a blog earlier this year, tiptoeing around the implications of the new models.

"Higher warming would allow less time to adapt and mean a greater likelihood of passing climate 'tipping points' such as thawing of permafrost, which would further accelerate warming."

A third to 99 percent of top-layer permafrost could melt by 2100 if carbon pollution is not abated, releasing billions of tonnes of greenhouse gases into the air, according to a draft IPCC special report on oceans and Earth's frozen zones obtained by AFP.

"Unfortunately, our global failure to implement meaningful action on climate change over recent decades has put us in a situation where what we need to do to keep warming to safe levels is extremely simple," said Rogelj.

"Global greenhouse gas emissions need to decline today rather than tomorrow, and global CO2 emissions should be brought to net zero."

The 2014 basket of climate models show Earth warming on current trends an additional 3C by 2100, and at least 2C even if national carbon cutting pledges are all met.

The two French climate models, including one from France's National Centre for Meteorological Research (CNRM), were unveiled at a press conference in Paris.

Saturday, August 10, 2019

New Models Point to More Global Warming Than We Expected

New Models Point to More Global Warming Than We ExpectedBob Henson, Weather Underground. August 6, 2019.


Above: Marine stratocumulus clouds from the Pacific Ocean stream atop Chile’s Atacama Desert. Marine stratocumulus cover vast swaths of the tropical and subtropical oceans, where they reflect large amounts of sunlight and provide an overall cooling effect on climate. New global climate models are showing the potential for more global warming than long thought, perhaps due to a reduction in low-level clouds such as marine stratocumulus. Image credit: NCAR/UCAR Image and Multimedia Gallery.


Our planet’s climate may be more sensitive to increases in greenhouse gas than we realized, according to a new generation of global climate models being used for the next major assessment from the Intergovernmental Panel on Climate Change (IPCC). The findings—which run counter to a 40-year consensus—are a troubling sign that future warming and related impacts could be even worse than expected.

One of the new models, the second version of the Community Earth System Model (CESM2) from the National Center for Atmospheric Research (NCAR), saw a 35% increase in its equilibrium climate sensitivity (ECS), the rise in global temperature one might expect as the atmosphere adjusts to an instantaneous doubling of atmospheric carbon dioxide. Instead of the model’s previous ECS of 4°C (7.2°F), the CESM2 now shows an ECS of 5.3°C (9.5°F).

“It is imperative that the community work in a multi-model context to understand how plausible such a high ECS is,” said NCAR’s Andrew Gettelman and coauthors in a paper published last month in Geophysical Research Letters. They added: “What scares us is not that the CESM2 ECS is wrong…but that it might be right.”

At least eight of the global-scale models used by IPCC are showing upward trends in climate sensitivity, according to climate researcher JoĆ«lle Gergis, an IPCC lead author and a scientific advisor to Australia’s Climate Council. Gergis wrote about the disconcerting trends in an August column for the Australian website The Monthly.

Researchers are now evaluating the models to see whether the higher ECS values are model artifacts or correctly depict a more dire prognosis.

“The model runs aren’t all available yet, but when many of the most advanced models in the world are independently reproducing the same disturbing results, it’s hard not to worry,” said Gergis.

A potential upending of a four-decade consensus

The IPCC issues comprehensive climate assessments every few years, along with interim reports on special topics in between. The IPCC’s Sixth Assessment Report (AR6) will be written over the next several years and released in 2021-22, based on papers being published through the end of 2019.

Back in 1979, a landmark U.S. climate study informally called the Charney Report estimated that the planet’s equilibrium climate sensitivity was between 1.5°C and 4.5°C. Each of the IPCC’s five major assessments since 1990 has largely agreed with this conclusion, although a few individual models have gone outside the range.

Figure 1. The consensus range of equilibrium climate sensitivity (ECS) from each of the IPCC's five assessment reports released since 2000. Model assessment is still under way for the sixth report, due in 2021-22. Also shown are ECS values for each of the models contributed by the National Center for Atmospheric Research (NCAR) since the third IPCC report in 2001, as well as the value for the NCAR Community Earth System Model, version 2 (CESM2), which is being used in the next IPCC assessment. Image credit: Values drawn from archived IPCC asssessments. Note: This image has been updated to add the CESM1 value and correct the CESM2 value.


“It does indeed look like many of the latest models will have ECS values higher than the IPCC ‘likely range’ of 1.5-4.5°C,” said Peter Cox (University of Exeter) in an email. “It seems that the new models with high ECS have more low-level cloud that tends to burn off under climate change, producing an amplifying feedback on warming.”

Cox is lead author of a 2018 study in Nature that examined temperature variability around long-term warming. The study concluded that the odds of ECS going outside the long-accepted range of 1.5-4.5°C were very small. “It is worth noting that observational constraints from both the temperature trend and temperature variability still suggest ECS of around 3°C,” said Cox. “So climate science has a conundrum to solve here.”

Clouds in the picture

Cloud-related effects have long been one of the biggest question marks in projecting future climate change, apart from uncertainties in future greenhouse emissions that hinge on human behavior. Low clouds—especially marine stratocumulus, which cover huge swaths of tropical and subtropical ocean—are especially crucial, as they tend to cool the climate by reflecting large amounts of sunlight.

Figure 2. Instruments aboard NASA's CERES satellite analyze Earth’s total radiation budget and provide cloud property estimates that enable scientists to assess clouds’ roles in radiative fluxes from the surface to the top of the atmosphere. Image credit: NASA.


The recent concerns about low-level clouds have been reinforced by ongoing work at NASA drawing on data from the CERES satellite program (Clouds and the Earth’s Radiant Energy System). Measuring the amount of energy entering and leaving the top of Earth’s atmosphere, CERES data shows that net energy in the atmosphere and oceans has climbed steadily with the increase of human-produced greenhouse gases—including both during and after the so-called “hiatus” in global temperature from about 2000 to 2013, when the oceans took up extra energy.

After 2013, the eastern Pacific saw a major drop in low cloud cover, global air temperatures spiked, and “there was a huge increase in sea surface temperatures,” said CERES principal investigator Norman Loeb, who outlined the changes in a 2018 paper.

Loeb is now analyzing how well the models for the upcoming IPCC report—with the higher sensitivities in place—can reproduce cloud cover and air temperature during and after the hiatus, given sea surface temperature. He discussed initial results last month at the 27th IUGG General Assembly (International Union of Geodesy and Geophysics), held in Montreal.

According to Loeb, "some of the models do really darn well” in depicting the cloud changes of the past two decades. He cautions: “I don’t know how far you can extrapolate this. There’s a danger in saying ‘you take the current record and the models nail it, therefore they have the climate sensitivity right.’ I’m cautious about making that leap, but it’s intriguing that they are nailing that post-hiatus difference.”

Figure 3. Differences in sea surface temperatures (left) and in CERES/MODIS-observed energy reflected from low clouds at the top of the atmosphere (right) between the so-called “hiatus” period of dampened surface air temperature increase (defined here as July 2000 – June 2014) and the subsequent period of amplified air temperature increase (July 2014 – June 2017). The post-hiatus period saw a dramatic increase in surface temperature across much of the eastern Pacific, together with a marked decrease in low-level cloud cover. Image credit: Courtesy Norman Loeb.


A 2019 study in Nature Geoscience that used a fine-scale cloud dynamic model found that marine stratocumulus could be depleted in large amounts if carbon dioxide levels were to reach about four times their current values, possibly triggering up to 8°C in additional global warming. See the post from last May by Dr. Jeff Masters on this paper.

Clouds and pollutants

The new NCAR model is based on tests of nearly 300 model configurations, with a focus on how well the models simulated pre-industrial climate and how well they reproduced the main global temperature trends of the last century. These trends include warming from 1920 to 1940, a period of roughly steady global temperature with regional cooling in the mid-20th century, and a more sustained global warming since the late 20th century.

The model also took into account new estimates of aerosol emissions (soot and other particles and droplets). These estimates were designed to be employed by all of the latest IPCC model configurations. Aerosol pollution tends to cool the climate overall, both by blocking sunlight directly and by serving as nuclei for clouds that block sunlight more effectively.

The new data on aerosol emissions led to a stronger cooling effect in the NCAR model than previous versions. However, the stronger aerosol-related cooling also led to an unrealistic portrayal of 20th century climate. When the model was reconfigured in response, it produced a more accurate reproduction of 20th- and 21st-century climate, including cloud behavior—but with a higher ECS, which pointed to a more ominous portrayal of future change.

If the higher ECS in the new models turns out to be on the right track, “it's really bad news,” said Gettelman. “It means we are going to be on the warm end of projections, with larger impacts for any given emissions trajectory.”

A durable index

The ECS allows for apples-to-apples comparison between the bare-bones climate models of decades ago and the far more sophisticated versions now in place. The ECS calculations begin with an instant doubling of carbon dioxide, whereas in our actual atmosphere, carbon dioxide is increasing gradually rather than all at once. The warming produced by the end of a more gradual doubling of CO2 rise is called transient climate sensitivity (TCS). “While TCS may be a better metric for comparison to observations and estimating near-term climate response…ECS has a long history as a convenient metric of future climate change,” said the authors in their GRL paper.

The amount of carbon dioxide in the atmosphere has increased by about 45% during the rapid industrialization of the last 150 years. Since regular measurements began atop Mauna Loa, Hawaii, CO2 concentrations have increased from about 315 parts per million in 1957 to around 410 ppm today. Fossil fuel burning and other human activities generate more than 35 billion tons of airborne CO2 a year. Just over half of that is absorbed by oceans, soil, and plants, and roughly a third of the atmospheric remainder stays in the air for a century or more (some of it for thousands of years).

Although other human-produced greenhouse gases warm the planet—methane molecules, in particular, are very powerful warming agents—CO2 is expected to account for most of the human-produced warming over the next few decades and beyond, as it remains in the atmosphere much longer than methane and is much more prevalent.