Showing posts with label Morgan. Show all posts

Sunday, May 23, 2021

Tim Morgan on Reality and the Route to Net Zero

#200. Other roads, part one. Tim Morgan, Surplus Energy Economics. May 22, 2021.

REALITY AND THE ROUTE TO NET ZERO

The release of a new policy document from the International Energy Agency marks a decisive stage in the evolution of the consensus around energy, the environment and the economy. Apart from anything else, Net Zero By 2050: A Roadmap for the Global Energy Sector reinforces the growing sense of commitment to a rapid transition away from reliance on climate-harming fossil fuels.

This policy paper confirms how closely the IEA is aligned with the broad thrust of policy intent in the United States, Britain and the European Union. Emerging economies like China and India might be harder to convince.

It would be easy to critique this document, applauding its ambition whilst questioning some of its methodologies and policy conclusions.

What matters much more, though, is the broad question of how we understand the interconnection between energy, the economy and the environment.

Granted that environmental risk is a function of our use of energy, are energy needs themselves a function of an economy that ‘grows’ according to its own, self-propelled, essentially financial and internal dynamic?

Or should the relationship be reversed, identifying economic prosperity as a subsidiary property of the use of energy?


From which direction?

It was pointed out to me recently that, whilst articles here make frequent reference to SEEDS, the meaning of this acronym is seldom explained. This is an omission based in familiarity and brevity, not reticence.

The short answer is that SEEDS – the Surplus Energy Economics Data System – is an economic model based on recognition that the economy is an energy dynamic. This means that it’s radically different from conventional models, which treat the economy as a wholly financial system.

This difference of approach may sound theoretical, but its practical implications could hardly be more far-reaching.

To illustrate, imagine that you’re trying to predict the future demand for some product or service. Conventionally, you’d do this by starting with GDP, and applying a forward rate of growth to calculate the size of the economy at some date in the future. With this as ‘a given’, you have the parameters or context for estimating the potential size of your market. What matters now is the potential expansion or contraction of demand for your product as a share of that broad context.

Your aim, of course, is practical rather than theoretical – you want to predict the scale and shape of the market for your product or service. You’re unlikely to be interested in the theory of economics itself, and are, in all probability, content to work within consensus methods, and arrive at consensus results. Even if your organization is big enough to employ its own economists, the probability is that this makes no real difference at all to the methodologies used, and very little difference to the resulting forecast.

Governments work in much the same way – they start by projecting, along conventional lines, the probable size of the national economy of the future, and only then assess the implications for the many aspects of policy.

The same approach is used for the forecasting of future energy requirements. All such conventional projections start with an assumption about the future size of the economy, and only then calculate what that is going to mean for energy needs. The near-unanimity of conventional forecasting right now is that the economy, meaning GDP, will grow at a trend rate of 3%.


Travelling to Net Zero

Hitherto, the resulting informed consensus around energy has been that, whilst renewable energy sources (REs) will capture an ever-increasing share of the energy market, the quantities of fossil fuels used will continue to increase. In contesting this, the IEA report applies a significantly new impetus to the direction of travel in the forecasting of future energy needs.

To be sure, there are differences between proposals and forecasts. Even so, the IEA’s Net Zero is an almost breathtakingly bold break from the prior consensus. It argues that rapid commitment to energy transition can, by 2050, deliver a world with zero net emissions of CO2.

In addition to massively increased investment in renewable sources of energy (REs), the IEA calls for the immediate cessation of all new oil and gas development projects. This amounts to an accelerated run-down of supplies of legacy energy from fossil fuel sources.

The pay-off, says the IEA, isn’t just the prevention of catastrophic degradation of the environment, but includes millions of new jobs and a big – and this time a more globally-inclusive – spurt of economic expansion.

You won’t be expecting me to agree that all of this is feasible, and I don’t. Let’s be clear, though, that the IEA, and others, are absolutely right to stress the need for transition away from climate-harming fossil fuels to REs.

Indeed, SEEDS analysis takes this imperative even further.

Environmentalists – whose ranks now include most Western governments, as well as organisations like the IEA – assert that continued reliance on fossil fuels risks inflicting irreparable harm to the environment.

Where SEEDS goes further is in arguing that, whilst continued fossil fuel dependency would probably wreck the environment, it would certainly destroy the economy.

The explanation for this is simple – it is that the cost of fossil fuel energy is rising, such that its net (post-cost) value is decreasing.

What this means is that the established sources of energy value that have powered the Industrial Age are fading away.


Thinking – forwards or backwards?

This brings us back to the critical issue of method. Instead of assuming a future economy of a given size, and then working backwards to the energy that this economy will require, SEEDS starts with energy projections, and only then asks what size of economy can be supported by the forward outlook for energy.


Put another way, SEEDS dismisses any notion of commencing with an assumed rate of growth in economic output. At the same time, the model also dismisses the idea that GDP is, or can be, a meaningful metric for economic prosperity.

Consensus forward “growth” assumptions, typically 3%, are based on a supposedly cautious continuation of what are accepted as recent trends. These depict the economy, measured as GDP, as something capable of expanding at annual rates of between 3.25% and 3.75%.

That seems to check with stats showing that, between 1999 and 2019 – that is, in the twenty years before the coronavirus shock – annual increments to reported GDP averaged 3.6%.

What this ignores is that, over that same period, annual net borrowing averaged 10.4% of GDP. Unless you believe that the spending of newly-created purchasing power has no effect on the activity measured as GDP, then changes in GDP itself are linked to the rate at which credit expands.

Moreover, debt is by no means the only form of forward obligation whose expansion is linked to economic activity. Whilst each $1 of reported “growth” between 1999 and 2019 was accompanied by an increase of nearly $3 of debt, adding in the expansion of broader financial obligations lifts this ratio to well over $6 of new commitments for each dollar of “growth”.

As so often, the acid test for such varying interpretations is observation. If conventional data is right, global GDP increased by 110% between 1999 and 2019, whilst population numbers expanded by 26%. Even after a surprisingly modest fall (of -3.3%) in world GDP during crisis-hit 2020, output was still higher by 103% over a period (1999-2020) in which population growth was 27%.

This ought, surely, to mean that the economy is in far better shape now than it was back in 1999. Sharply higher prices for assets such as stocks and property seem to reinforce this optimistic reading.

But the economy as we observe it today doesn’t conform to this description.

Most obviously, we’re caught in a stimulus trap. If we carry on pouring gargantuan amounts of liquidity into the system, we face a very real risk of the hyperinflationary destruction of the value of money. But if we stop – or even scale back on – stimulus, asset prices would crash, and a cascade of defaults would ensue.

Can we square this observation of ‘fragility edging into crisis’ with the assurance that economic output has almost effortlessly out-grown population numbers over a very extended period?

The answer, of course, is that we can’t.

After all, if the economy had been performing as strongly as prior growth rates imply, why would we still be locked into a supposedly “temporary” and “emergency” reliance on negative real interest rates that began back in 2008-09?

We can’t, to any significant extent, put the blame for this on covid-19, not least because the official data itself puts the scale of the hit to the economy in 2020 at only -3.3%. At worst, then, we’ve lost a single year of the growth supposedly enjoyed during each of the twenty years preceding the pandemic.

The bottom line is that GDP stats are telling us one thing, and what we can see unfolding right in front of our eyes is the diametric opposite. On the one hand we have an economy that’s growing robustly – on the other, an economy dependent on the life-support of financial gimmickry, and trapped in a cul-de-sac from which there is no obvious route of escape.


Other roads

This is where alternative approaches are so important. To be clear, economic orthodoxy describes a robust economy that doesn’t exist, whilst policy orthodoxy is based on the continuation of positive trends which, it turns out, don’t exist either.

The SEEDS approach begins with three observations, familiar to regular readers and requiring only the briefest introduction for those for whom this is new.

First, the economy is an energy system, because literally everything which constitutes economic output is a product of the use of energy.

Second, whenever energy is accessed for our use, some of that energy is always consumed in the access process. This second principle establishes the role of the Energy Cost of Energy (ECoE), and divides the stream of energy and its associated economic value into “cost” (ECoE) and “profit” (surplus) components.

The third principle is that money has no intrinsic worth, but commands value only as a ‘claim’ on the products of the energy economy.

An economy stripped of money would have to resort to barter, or would have to create a replacement human artefact as a medium of exchange.

An economy stripped of energy, on the other hand, would, as of that moment, cease to exist.

These principles identify a dynamic which, though complex in application, is straightforward in principle. We use energy to create economic value. Some of this energy value has to be used in the energy access process itself. What remains powers all economic activity other than the supply of energy itself. ECoE is the factor which differentiates between economic output and material prosperity.

From this perspective – and in an economy which still derives four-fifths of its primary energy supply from oil, gas and coal – a critical trend has been the relentless rise in the ECoEs of fossil fuels.

This increase in ECoEs fits with observable trends, first by explaining the emergence (though not, in general, the accurate interpretation) of “secular stagnation” in the 1990s, and then by tracking the subsequent, crisis-strewn descent into that dependency on the credit and monetary gimmickry that has created the stimulus trap described earlier.

In short, what SEEDS interpretation says should happen as ECoEs rise coincides with what has happened as this trend has developed.


Feasible directions?

To resolve this issue, and to restore the capability for growth as well as minimising environmental harm, a transition to REs would need to accomplish two things.

First, it would need to provide a volumetric replacement for fossil fuels. This, unfortunately, is about as far as the conventional setting of targets usually goes.

Second, and critically, it would also need to drive overall, all-sources ECoEs back downwards.

For Western countries, successful ‘transition with growth’ would need, at a minimum, to drive overall ECoEs back below 5%, from a current global trend ECoE level of 9% and rising. For advanced economies, whose complexity involves high maintenance requirements in terms of ex-ECoE (surplus) energy, 5% is the upper ECoE parameter beyond which prior growth in prosperity goes into reverse.

Put another way, driving ECoEs down from 9% to 5% might be enough to forestall “de-growth”, but wouldn’t be low enough to reinstate growth itself. To achieve that, we’d need to push ECoEs down a lot further, probably to levels below 3.5%.

The volumetric side of the transition equation is tricky, and has been costed at between $95 trillion and $110tn. The financial price tag, of course, isn’t the issue, least of all in a world in which money is routinely conjured out of thin air. What matters is the quantity of material inputs which these sums represent.

Let’s assume, for purposes of hypothesis, that the Earth can supply the requisite amounts of raw materials necessary for the provision of inputs ranging from steel and copper to plastics, lithium and concrete.

As we know, accessing these materials and putting them to use is absolutely dependent on the use of energy. Without energy-intensive activity, we can’t even supply water, let alone extract minerals and convert them into components.

In short, the principle of ECoE – which applies, not just to the creation of capacity, but to its operation, maintenance and replacement as well – tells us that getting energy from RE sources at the scale that we require is absolutely dependent on the prior use of energy for these purposes.

Since, at least for the foreseeable future, the supply of these materials depends on legacy energy from fossil fuels, the ECoEs of renewables are linked to those of oil, gas and coal.


Identifying process

So here’s the equation that net zero combined with growth invites us to accept.

On the one hand, energy sourced from fossil fuels declines rapidly. On the other, physical products of energy – the inputs that we’ll need to expand RE supply dramatically – will become available in very large amounts.

Another way to put this is that we’re planning to abandon the sunk energy invested in the carbon infrastructure, and build a replacement infrastructure at global scale, and carry on driving, flying and doing everything else that we do with energy, at the same time as we’re driving down energy supply from legacy sources.

An obvious snag here is that nobody seems prepared to tell us what uses of energy will need to be relinquished in order to free up the resources needed for physical investment at a transformational scale.

If we free ourselves from the delusion that the economy is some kind of self-perpetuating, wholly-financial, perpetual-motion mechanism operating independently of energy, the only way to square this circle is to rely on indefinite cost reduction through continued progress in technology. This is why faith in the indefinite advance of technology is implicit in so many aspects of the ‘net-zero-without-economic-sacrifice’ narrative.

The problem with this is that it overlooks the reality, which is that the scope of technology is bounded by the physical parameters of the resource. This, of course, is why no amount of technology – or, for that matter, of financial commitment – has been able to use shale resources to turn the United States into “Saudi America”.

In addition to technological extrapolation to a point beyond the limits of physics, the critical snag with driving the ECoEs of REs downwards far enough is the fallacious assumption that, through some kind of internal financial dynamic, the economy can “grow”, of its own accord, to make all of the necessary transitional steps possible.

If we once accept the proposition that, whilst energy use falls, real economic output can rise, then we’re in danger of endorsing the fantasy that we can “de-couple” the economy from the use of energy. And, since we cannot produce anything of any economic utility at all without using energy, “de-coupling” is a logical impossibility.


From here

None of this is to say that we can’t, or shouldn’t, bend every effort to transition from fossil fuels to renewables. On the contrary, the transition to net zero goes far beyond the desirable, and into the imperative.

Far from contesting the necessity for transition, SEEDS establishes a compelling economic as well as an environmental case for endeavouring to do exactly that. An economy tied in perpetuity to the rising ECoEs of fossil fuels would face inexorable deterioration.

This isn’t a trend that we have to predict, because it’s beyond doubt that this is already happening.

Where SEEDS-based analysis parts company with the ‘new consensus’ is over the belief, amounting to an article of faith, that this process (a) can be accomplished without sacrifice, and (b) can be combined with economic growth.

Any given quantity of energy cannot be used more than once. Legacy energy value from fossil fuels, already a finite quantity, becomes a smaller finite quantity under plans to accelerate the abandonment of oil, gas and coal.

A situation in which this limited quantity of legacy energy is used to expand RE supply, and to build the requisite infrastructure, and to maintain current energy uses such as driving and flying, fails the test of practicality. The associated assumptions – that technology will provide a fix for everything, and that the economy ‘will carry on growing’ thanks to some kind of internal momentum – fail the test of logical interpretation.

All of this, of course, carries the obvious, if startling, implication that we’re trying to progress to a desirable destination using a basis of planning that’s demonstrably false.

The pace at which we should abandon the use of fossil fuel energy is a matter for debate.

But the need to abandon those fallacious, money-only methods of interpretation which create the myth of the economy as a perpetual-motion machine, growing ever larger through an internal mechanism disconnected from energy, has become imperative.

Sunday, February 28, 2021

More excellence from Tim Morgan: Mapping the economy

Mapping the economy, part one. Tim Morgan, Surplus Energy Economics. Feb. 12, 2021.


HOW WE CAN MEASURE PROSPERITY

Introduction

Because almost every aspect of our lives is shaped by material prosperity, anyone wishing to understand issues such as government, business, finance and the environment needs to make a choice between two conflicting interpretations.

One of these is that the economy is a purely financial system which, if it were true, would mean that our economic fate is in our own hands – our ability to control the human artefact of money would enable us to achieve growth in perpetuity.

The other is that, on the contrary, money simply codifies prosperity, which itself is determined by the use of energy. This interpretation ties our circumstances and prospects to the cost and availability of energy, and explains growth in prosperity since the late 1700s as a function of the availability of cheap and abundant energy from coal, oil and gas.

The critical factor in the energy equation is the relationship between the supply of energy and the cost (expressed in energy terms) of putting energy to use. The cost element is known here as ECoE (the Energy Cost of Energy), which has been rising relentlessly over an extended period.

This means that ECoE is the ‘missing component’ in conventional economic interpretation. Whilst ECoE remained low, its omission mattered much less than it does now. This is why conventional, money-based economic modelling appeared to work pretty well, until ECoE became big enough to introduce progressive invalidation into economic models. This process can be traced to the 1990s, when conventional interpretation noticed – but could not explain – a phenomenon then labelled “secular stagnation”.

If economics should indeed be understood in energy terms, the possibility exists that we can model the economy on this basis, expressing in financial ‘language’ findings derived from energy-based interpretation. From the outset, this has been the aim of the SEEDS economic model. The alternatives to this approach are (a) to persist with money-based models which we know are becoming progressively less effective, or (b) to give up on modelling altogether, and ‘to blindly go’ into a future that we cannot understand.

SEEDS has now reached the point at which we can ‘map’ the economy on a comprehensive basis, starting with a top-level calibration of prosperity which shows that rising ECoEs are impairing the material value of energy, and will in due course reduce energy availability as well.

Starting from this top-level calibration, SEEDS goes on to map out the ways in which, as we get poorer, our scope for discretionary (non-essential) consumption will decrease, whilst economic systems will become less complex through processes including simplification (of products and processes) and de-layering.

As involuntary “de-growth” sets in, a financial system based on the false premise of ‘perpetual growth’ will fail, resulting in falls in asset values and a worsening inability to meet prior financial commitments. If we persist in using monetary manipulation in an effort to defy economic gravity, the result will be a degradation in the quality and viability of current monetary systems.

As personal prosperity shrinks, public priorities will switch towards a greater emphasis on matters of economic well-being, including the choices that we make about the use of prosperity, and its distribution as wealth and incomes.

The aim here is to explain the mapping process and set out its findings. This article starts the process by looking at how prosperity is calibrated, and the trends to be anticipated in aggregate and per-person prosperity.

A second article will evaluate what this will mean in various areas, including finance, business and government. It might then be desirable to examine how we might best adapt our systems to accommodate changes in an economy that is turning out not be a money-driven ‘perpetual growth machine’ after all.


PART ONE: CALIBRATING PROSPERITY

Energy supply

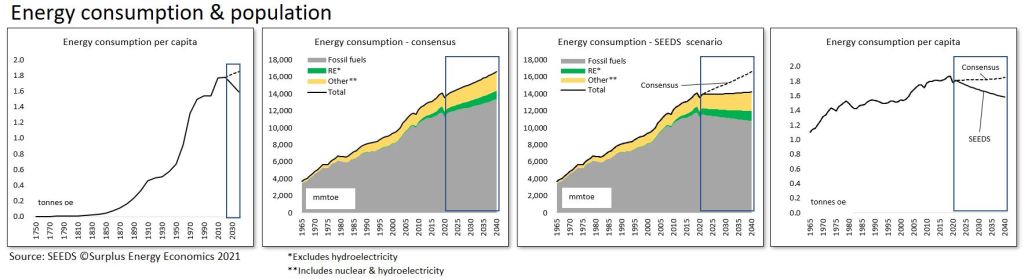
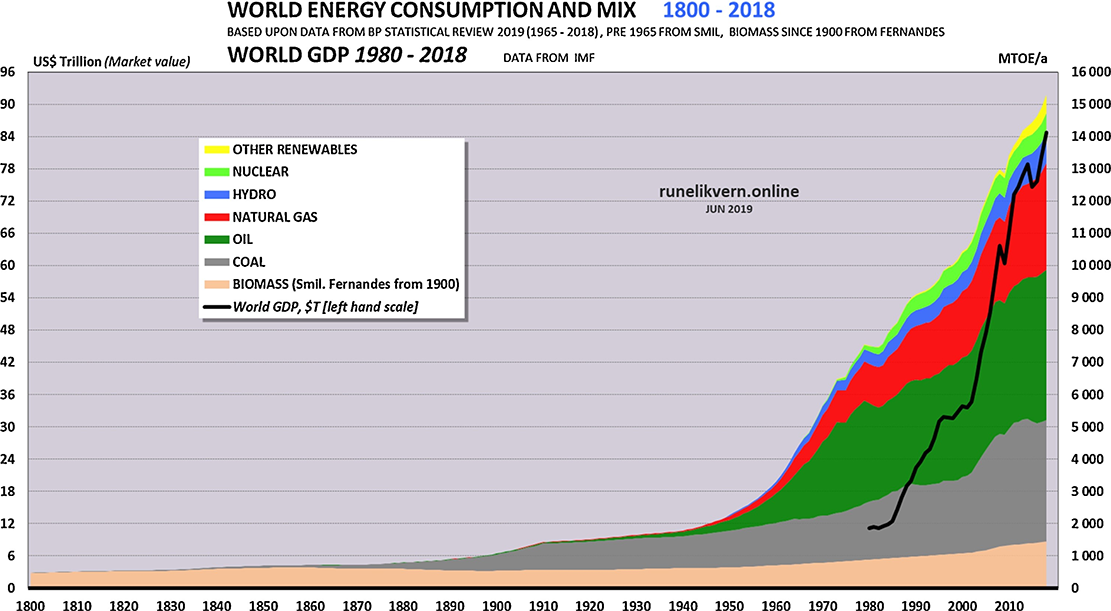
It’s an observable reality that the dramatic expansion in population numbers and economic activity since the start of the Industrial Age in the late 1700s has been a product of access to cheap and abundant energy from coal, oil and natural gas.

This has been reflected in a correspondingly rapid rise in energy use per capita. This metric has expanded along an exponential progression that has been checked only twice – once during the Great Depression of the 1930s, and again during the oil crises of the 1970s. Even these interruptions to this progression turned out to be temporary, though both were associated with severe economic hardship and financial dislocation.

Importantly, neither of these events was a function of changes in energy fundamentals. Rather, both were consequences of mismanagement within a physical (energy) context which remained favourable for growth. Preceding financial excess was at the root of the Great Depression, whilst the crises of the 1970s resulted from a breakdown in the relationship between producers and consumers of oil.

In recent times, belated recognition of the threat posed to the environment by the use of fossil fuels has shifted the focus towards ambitions for dramatic increases in renewable sources of energy (REs). But the assumption has remained that we will nevertheless be using more energy, not less – and, very probably, more fossil fuels – for the foreseeable future.

The consensus expectation, as of late-2019, was that, despite an assumed rapid increase in the supply of REs, the world would nevertheless be using about 14% more fossil fuels in 2040 than it used in 2018, with the consumption of oil increasing by 10-12%, and no overall fall in the use of coal.

These assumptions were reflected in the depressing conclusion that emissions of CO² would continue to grow, with massive investment in non-fossil alternatives doing nothing more than blunt the rate of emissions increase.

The flip-side of these projections was the almost unchallenged faith that continued to be placed in a ‘future of more’ – for example, it was assumed that, by 2040, there would be an increase of about 75% in the world’s vehicle fleet, and that passenger flights would have expanded by about 90%. Automation – as a use of energy – would continue, as would the consumption of non-essential (discretionary) goods and services.

Government, business and financial planning remains predicated on this assumption of never-ending economic expansion.

Fundamentally, none of these assumptions has been re-thought because of the coronavirus crisis. Expectations for the future ‘mix’ of energy supply may have changed since late-2019, but the consensus view seems to remain that, after the energy consumption hiatus caused by the covid crisis, the future will still be shaped by a continuing expansion in the use of primary energy. It still seems to be assumed that there will be no overall reduction in the use of fossil fuels, at least until the middle years of the century. Needless to say, faith in a ‘future of more’ remains unshaken.

Some commentators may opine that the fossil fuel industries are ‘finished’, but realistic assessments of the rates at which RE capacities are capable of expanding do not support a view that REs can expand rapidly enough to replace much of our current reliance on oil, gas and coal.

The problem with all of the consensus forecasts seems to be that forward energy use projections are a function of economic assumptions. Thus, if the economy is assumed to be X% bigger by, say, 2040, then its energy needs will have risen by Y%, and the deduction of non-fossil supply projections for 2040 leaves our need for fossil fuels in that year as a residual.

This, of course, is to take things in the wrong order. What we should be doing is assessing the future energy outlook, and only then asking ourselves how much economic activity the projected level (and cost) of energy supply is likely to support.

For this reason, SEEDS no longer uses consensus-based projections for future energy supply. The SEEDS alternative scenario sees the world having 8% less fossil fuel energy available in 2040 than was used in 2018. The inclusion of assumed rapid increases in contributions from non-fossil sources still leaves total primary energy supply no higher in 2040 than it was in 2018. Even this scenario might turn out to have been over-optimistic.

This in turn means that primary energy use per person has now started to decline. Something along these lines happened during the 1930s and the 1970s, but neither was more than a temporary hiatus in a continuing upwards trend.

Fig. A


ECoE and surplus energy

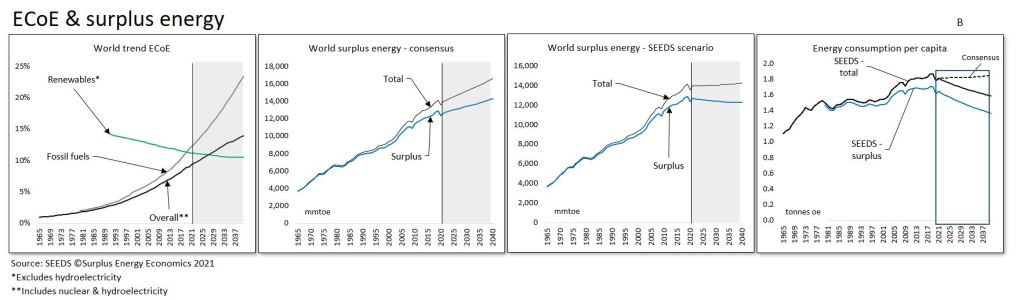
For the purposes of economic modelling, the aggregate amount of energy available at any given time needs to be calibrated to incorporate changes in the energy cost of accessing that energy. The principle involved is that, whenever energy is accessed for our use, some of that energy is always consumed in the access process, meaning that it is not available for any other economic purpose. This ‘consumed in access’ component is known here as ECoE (the Energy Cost of Energy).

The processes which drive changes in the level of ECoE are reasonably well understood. In the early stages of the use of any type of energy, ECoEs are driven downwards by a combination of geographic reach and economies of scale. Once these drivers are exhausted, depletion kicks in, driving ECoEs back upwards.

Technology acts to reinforce the downwards pressures exerted by reach and scale, and mitigates the upwards cost pressure of depletion. But the scope of technology is limited by the physical characteristics of the energy resource, such that no amount of technological progress can, for instance, cancel out the effects of depletion.

Thanks to scale and reach, assisted by progress in technology, the ECoEs of fossil fuels fell steadily for most of the Industrial Age until they reached a nadir that occurred during the twenty years after 1945. This meant that, until this nadir arrived, we benefited both from increasing total energy supplies and from falling ECoEs. This is to say that ‘surplus’ (ex-ECoE) energy availability increased more rapidly than the totality of supply.

For a long time now, though, the ECoEs of oil, gas and coal have been rising, a function of depletion, only partially mitigated by technology. With fossil fuels still accounting for more than four-fifths of all primary energy consumption, this has meant that overall ECoE, too, has risen relentlessly. This overall trend, as calibrated by SEEDS, is that ECoE rose from 1.8% in 1980 to 4.2% in 2000 and 6.4% in 2010, with the number for 2020 put at 9.0% and an ECoE of 11.6% projected for 2030.

This interpretation, taken together with volume projections – themselves heavily influenced by ECoE cost trends – suggest that the decline in total energy use per person will be compounded by a still-faster fall in surplus energy supply per person. This, incidentally, means that surplus energy, both in aggregate and per capita, would fall even if the over-optimistic consensus view on aggregate energy supply turned out to be correct.

The great hope, of course, has to be that the downwards trend in the ECoEs of REs will continue indefinitely, eventually driving overall ECoEs back downwards. This is unlikely to happen, not least because expansion in RE capacity continues to depend on inputs made available by the use of resources whose availability relies on the use of fossil fuels. We cannot – yet, anyway – build wind turbines or solar panels using only the energy that wind and solar power generation can provide.

Though the ECoEs of REs are indeed at or near the point of crossover with those of fossil fuels, this is really a function of the continuing, relentless rise in the costs of accessing oil, gas and coal.

It is, of course, a truism that equal calorific quantities of energy from different sources have different characteristics. Energy from petroleum, for instance, is ideally suited for use in cars and commercial vehicles, whereas wind and solar energy are better suited to transport systems like trains and trams. Public transport systems, powered directly, can greatly reduce our reliance on the insertion of batteries into the sequence between the supply and use of electricity.

This, essentially, is a management issue, in which trying to drive petroleum-optimised vehicles with wind or solar electricity can be likened to trying to propel a sailing ship using steam directed at its sails.

Fig. B


Economic output

With the role of prosperity-determining surplus energy understood, the next stage in energy-based mapping of the economy is to connect this to the financial calibrations through which, by convention, economic debate is presented.

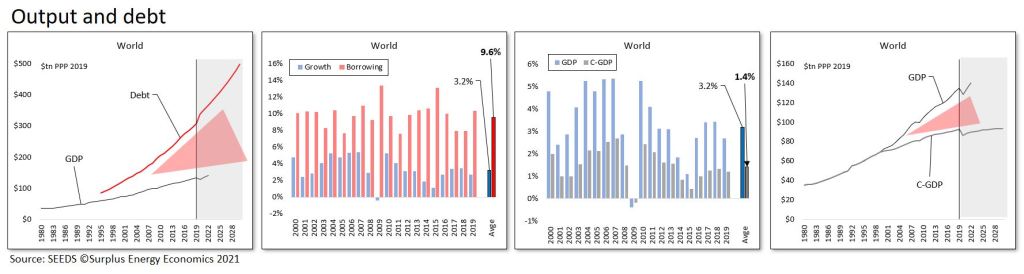
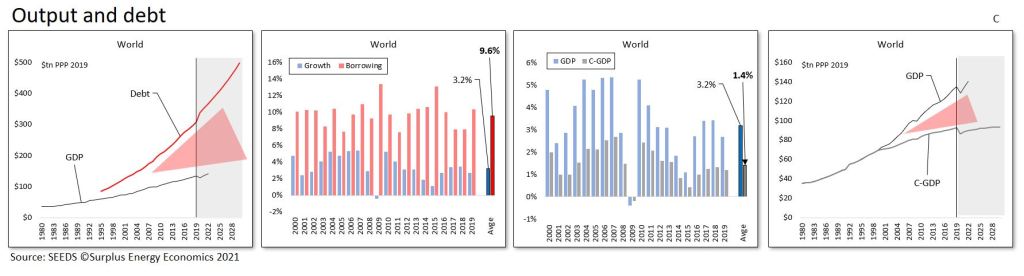
Unfortunately, the conventionally favoured metric of GDP is unsuited to this purpose, essentially because rapid expansion in debt (and in other liabilities) creates a sympathetic (and artificial) increase in apparent GDP.

Regular readers will be familiar with the ‘wedge’ interpretation set out in the next set of charts. Between 1999 and 2019, reported GDP increased by $66tn (PPP*) whilst debt expanded by $197tn, meaning that each dollar of reported “growth” was accompanied by $3 of net new debt. Over a period in which GDP grew at an average rate of 3.2%, annual borrowing averaged 9.6% of GDP.

With these credit distortions understood and excluded, the rate of growth falls from the reported 3.2% to just 1.4% on an underlying basis. The calibration of underlying or ‘clean’ output (C-GDP) reveals that the insertion of a ‘wedge’ between debt and C-GDP is reflected in the emergence of a corresponding wedge between reported (GDP) and underlying (C-GDP) economic output.

This in turn means that we are deluding ourselves, not just about the real level of economic output but also about the various ratios and distributions based upon that metric.

Fig. C


Prosperity

Ultimately, the basis of any effective system for interpreting and modelling the economy must be the identification of prosperity, a concept which can then be used as the denominator in a host of important equations. The SEEDS model accomplishes this by identifying C-GDP and then deducting trend ECoE.

C-GDP defines economic output, but recognition of the role of ECoE means that this output is not, in its entirety, ’free and clear’. Output, measured as C-GDP, is the financial counterpart of the aggregate energy available for use. But a proportion of this energy value – and, consequently, a corresponding proportion of economic output – is required for the supply of energy itself, and is not, therefore, available for any other economic purpose. Accordingly, trend ECoE is deducted from C-GDP output to arrive at a calibration of prosperity. This, of course, can be expressed either in aggregate or in per capita amounts.

Before going further, we can note that an equation involving four components defines material well-being calibrated as prosperity. First, we need to know the quantity (Q) of energy available for economic use. Second, we need to identify the conversion efficiency (CE) with which this energy is turned into economic value (O).

Third, we need to deduct ECoE to know how much of this economic value is ‘free and clear’ for use in all economic purposes other than the supply of energy itself.
 Fourth, the division of the resulting aggregate prosperity (P) by the population number (N) tells us the prosperity of the average person in the economy.

At the top level, this equation reveals the onset of a deterioration in global prosperity per person. Energy quantity growth (Q) is slowing, and the best we can expect for conversion efficiency (CE) is somewhere between static and gradually eroding. ECoEs are continuing to rise, and the number of people between whom prosperity (P) is shared continues to increase.

A summary of projected trends in prosperity per person is set out in the following table.

Table 1


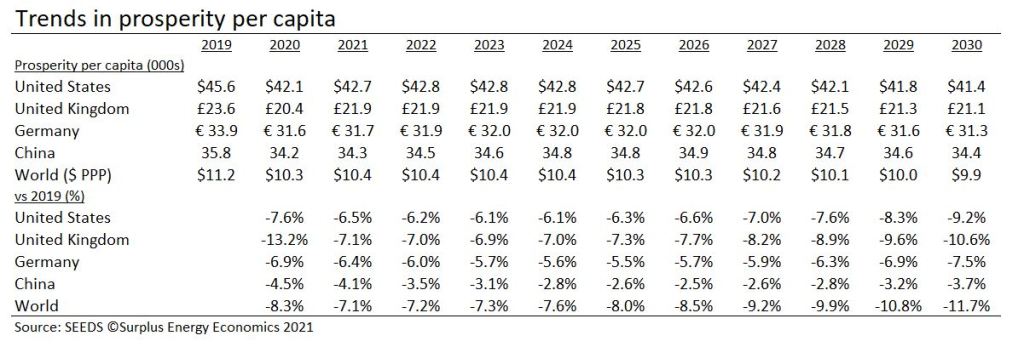
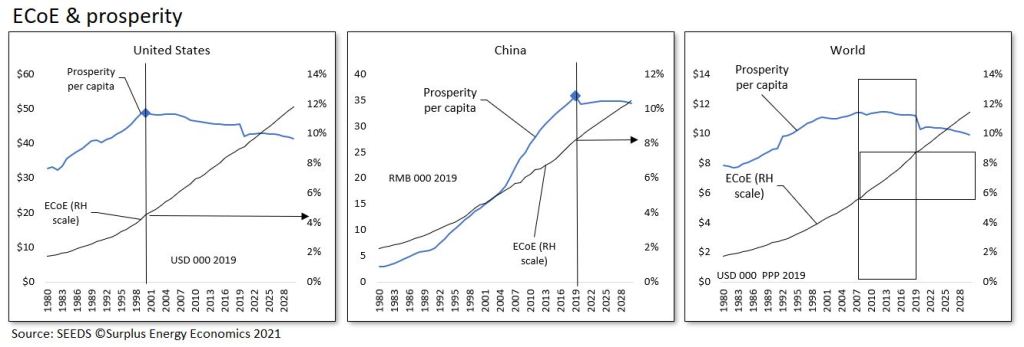
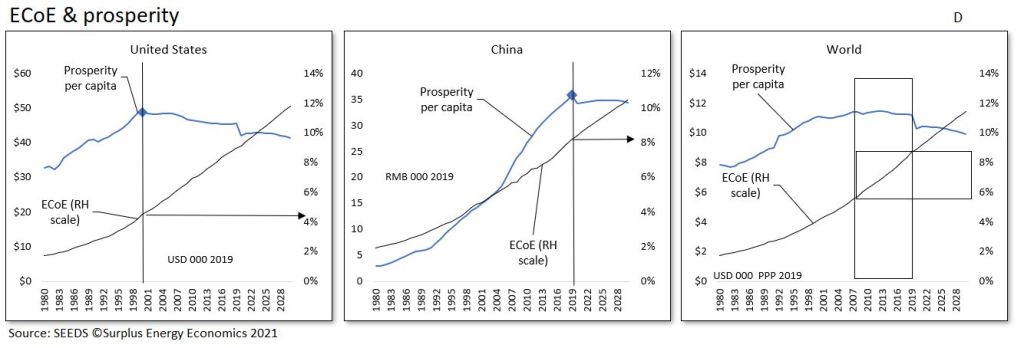
A critical determinant which emerges from this equation is the existence of a direct correlation between ECoE and prosperity per capita. In the United States, prosperity per person turned down after 2000, when American trend ECoE was 4.5%. The coronavirus crisis seems to have brought forwards the inflection-point in China to 2019, when the country’s trend ECoE was 8.2%.

Broad observation across the thirty countries covered by SEEDS indicates that complexity determines the level of ECoE at which prosperity per capita turns downwards. In the sixteen advanced economies group analysed by the model (AE-16), the inflection point occurs at ECoEs of between 3.5% and 5%. The equivalent range for the fourteen EM (emerging market) countries (EM-14) runs from 8% to 10%.

This has meant that EM countries’ prosperity has continued to improve as that of the AE-16 group has turned down. This in turn has meant that global, all-countries prosperity has been on a long plateau, with continued progress in some countries offsetting deterioration in others.

Now, though, the model indicates that the plateau has ended, meaning that, from here on, the world’s average person gets poorer.


Fig. D


These top-down findings are a good point at which to conclude the first part of this explanation of the energy-based mapping of the economy of which SEEDS is now capable. In Part Two, we shall follow some of its implications, looking at assets and liabilities, the outlook for businesses and the challenges facing government.


The map unrolled. Feb. 24, 2021.


THE CONCLUSIONS OF THE SEEDS MAPPING PROJECT

Foreword

What follows is one of the longest articles ever to appear here, and certainly one of the most ambitious. The aim is to take readers all the way through the Surplus Energy Economics interpretation of the economy, from principles and background, via energy supply and cost, to environmental implications, economic output and prosperity, and the circumstances and prospects of individuals, the financial system, business and government.

Because what follows includes some commentary on business, readers are
reminded that this site does not provide investment advice, and must not be used for this purpose. It is, as ever, to be hoped that issues of politics and government can be discussed in a non-partisan way, and that the principle of “play the ball, not the man” can be respected.

The reason for presenting this synopsis at this time is that the second phase of the SEEDS programme – the mapping of the economy from an energy-based perspective – is now all but complete. Three components of this programme remain at the development phase, but provide sufficient indicative information for use here. One of these is the calculation of “essential” calls on household resources; the second is conversion from average per capita to median prosperity; and the third is the SEEDS-specific concept of the excess claims embodied in the financial economy.

SEEDS began as an investigation into whether it was possible to model the economy on the right principles (those of energy) rather than the wrong ones (that the economy is simply a financial system). It was always going to be essential that results should for the most part be expressed in monetary language, even though the model itself operates on energy principles.

With prosperity calibrated, it then made sense to extend the model into comprehensive economic mapping. Aside from the three components still in need of further refinement, this mapping project is now complete.

For the most part, mapping as presented here is global in extent, though some national and regional data is used. If SEEDS is to continue, a logical next step would be to extend the mapping process to individual economies.

Lastly, by way of preface, this article is the most comprehensive guide to SEEDS and the Surplus Energy Economy yet published here, and it would be marvellous if readers were to see fit to pass it on to others as a way of ‘spreading the word’ about how the economy really works.


Introduction

Long before the coronavirus crisis, we had been living in a world suffering from a progressive loss of the ability to understand its own economic predicament. This lack of comprehension results directly from unthinking acceptance of the fundamentally mistaken orthodoxy that the economy is ‘simply a matter of money’.

If this were true – and given that money is a human artefact, wholly under our control – then there need be no obstacle to economic growth ‘in perpetuity’. This never-ending ‘future of more’ is nothing more than an unfounded assumption, yet it is treated as an article of faith by decision-makers in government, business and finance.

Growth in perpetuity’ is a concept which, though seldom challenged, is really an extrapolation from false principles. At the same time, those mechanisms which orthodox economics is pleased to call ‘laws’ are, in reality, nothing more than behavioural observations about the human artefact of money. They are not remotely equivalent to the real laws of science.

The fact of the matter, of course, is that the belief that economics is simply ‘the study of money’ is a fallacy, and defies both logic and observation. At its most fundamental, wholly financial interpretation of the economy is illogical, because it tries to explain a material economy in terms of the immaterial concept of money.

Logic informs us that all of the goods and services that constitute economic output are products of the use of energy. Other natural resources are important, to be sure, but the supply of foodstuffs, water, minerals and so on is wholly a function of the availability of energy. Energy is critical, too, as the link which connects economic activity with environmental and ecological degradation. Without access to energy, the environment would not be subject to human-initiated risk – and the economy itself would not exist.

Observation reveals an indisputable connection between the rapid material (and population) expansion of the Industrial Age and the use of ever-increasing amounts of fossil fuel energy since the first efficient heat-engines were developed in the late 1700s.

Two further observations are important here. The first is that, whenever energy is accessed for our use, some of that energy is always consumed in the access process. We cannot drill a well, build a refinery or a pipeline, construct wind turbines or solar panels, or create and maintain an electricity grid, without using energy. This ‘consumed in access’ component is known in Surplus Energy Economics as the Energy Cost of Energy, or ECoE.

The second critical observation is that money has no intrinsic worth, but commands value only as a ‘claim’ on the goods and services made available by the use of energy. Money can only fulfil its function as a ‘medium of exchange’ if there is something of economic utility for which an exchange can be made. Just as money is a ‘claim on energy’, so debt – as a claim on future money – is in reality a ‘claim on future energy’.


False premises, mistaken decisions

Critical trends in recent economic history can only be understood on the basis of energy, ECoE and exchange. ECoEs, which had fallen throughout much of the Industrial Age, turned upwards in the years after 1945 but, until the 1990s, remained low enough for their omission not to impose a visibly distorting effect on orthodox economic interpretation.

The point at which ECoEs became big enough to start invalidating conventional models was reached during the 1990s. The resulting phenomenon of economic deceleration was noted, and indeed labelled (“secular stagnation”), but it was not traced to its cause.

An orthodoxy resolutely bound to the fallacy of wholly financial interpretation naturally sought monetary explanations and monetary ‘fixes’. The idea that financial tools can overcome physical constraints can be likened to attempting to cure an ailing house-plant with a spanner. Its pursuit pushed us into ‘credit adventurism’ in the years preceding the 2008 global financial crisis, and then into the compounding and hazardous futility of ‘monetary adventurism’ during and after the GFC.

This has left us relying on false maps of a terrain that we do not understand. Almost all of our prior certainties have disappeared. We turned away from market principles by choosing financial legerdemain over market outcomes during 2008-09 and, at the same time, we abandoned the ‘capitalist’ system by destroying real returns on capital. The aim here is to present an alternative basis of interpretation that accords both with logic and with observation.

Beyond vacuous phrases which echo earlier certainties, governments no longer have ‘economic policies’ as such. Even the pretence of economic strategy was ditched when governments abdicated from the economic arena, and handed over the conduct of macroeconomics to central bankers. Asset markets have become wholly dysfunctional – they no longer price risk, and have been stripped of their price discovery function. The relationship between asset prices and all forms of income (wages, profits, dividends, interest and rents) has been distorted far beyond the bounds of sustainability.

Unless real incomes can rise – which is in the highest degree unlikely – asset prices must correct sharply back into an equilibrium with incomes that was jettisoned through the gimmickry of 2008-09. Efforts to prevent asset price slumps can only add to the strains already inflicted upon fiat currencies.

Ultimately, our manipulation of money has had the effect of tying the viability of monetary systems to our ability to go on ignoring and denying the realities of an economy being undermined by a deteriorating energy dynamic.


The energy driver

Our analysis necessarily starts with energy, a topic covered in more detail in
the previous article. The informed consensus position, immediately prior to the coronavirus crisis, was that total energy supply would continue to expand, increasing by about 19% between 2018 and 2040.

Within this overall trajectory, renewable energy sources (REs) would grow their share of primary energy use, and the combined contributions of hydroelectric and nuclear power, too, would expand.

Even so, it was projected that quantities of fossil fuels consumed would rise, with about 10-12% more oil, 30-32% more natural gas, and roughly the same amount of coal being used in 2040 as in 2018.

These consensus views were (and in all probability still are) starkly at variance with a popular narrative which sees us replacing most, perhaps almost all, use of fossil fuels by 2050. The rates of RE capacity expansion that the popular narrative implies would require vast financial investment and, more to the point, would call for a correspondingly enormous amount of material inputs whose availability is, for the foreseeable future, dependent on the continuing use of fossil fuels.

SEEDS uses an alternative energy scenario which projects a decline in the supply of fossil fuels, a trajectory dictated by the rising ECoEs of oil, gas and coal. Essentially, the costs of supplying oil, gas and coal have already risen to levels above consumer affordability. The SEEDS scenario anticipates a pace of growth in RE supply which, whilst outpacing the 2019 consensus, necessarily falls short of a popular narrative which is as weak on practicalities as it is strong on good intentions.

The result of this forecasting is that the total supply of primary energy is unlikely to be any larger in 2040 than it was in 2018.

What this in turn means is that energy supply per person will decline. Such a downturn has only been experienced twice (to any meaningful extent) in the Industrial Age – once during the Great Depression of the 1930s, and again during the oil crises of the 1970s.

Neither of these downturns was physical in causation – they resulted from mismanagement, rather than changes in energy supply fundamentals – but both were associated with serious economic hardship and severe financial dislocation. Furthermore, what happened in the 1930s and the 1970s wasn’t really a downturn but, rather, no more than a pause in the upwards trajectory of energy use per person.

These parameters are illustrated in Fig. A. All of the charts used here can be enlarged for greater clarity, and all of them are sourced from the SEEDS mapping system. [go to the article on Morgan's SEEDs site for better versions of the graphics] 

Fig. A


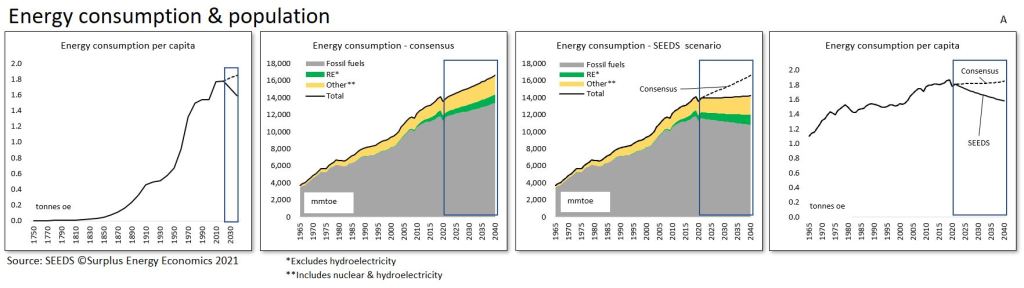
It will be appreciated, then, that we have entered a phase – of declining energy availability per person – which can be expected to have a profoundly adverse effect on economic well-being and financial stability.

These effects will be compounded by a relentless rise in ECoEs that is most unlikely to be stemmed by the volumetric expansion of REs.  As we shall see, prosperity per person turned down at ECoEs of between 3.5% and 5.0% in the advanced economies of the West, and at rather higher (8-10%) thresholds in EM (emerging market) countries. But we cannot realistically expect that the ECoEs of wind and solar power will fall much below 10%. This means that they cannot replicate the economic value delivered by fossil fuels in their heyday.

Accordingly, surplus energy per person – that is, the aggregate amount of energy less the ECoE deduction – is set to decline, and would do so even if the over-optimistic consensus projection for aggregate energy supply could be realised.

Anticipated trends in ECoEs and the availability of surplus energy are summarised in Fig. B.

Fig. B


Cleaner, but poorer

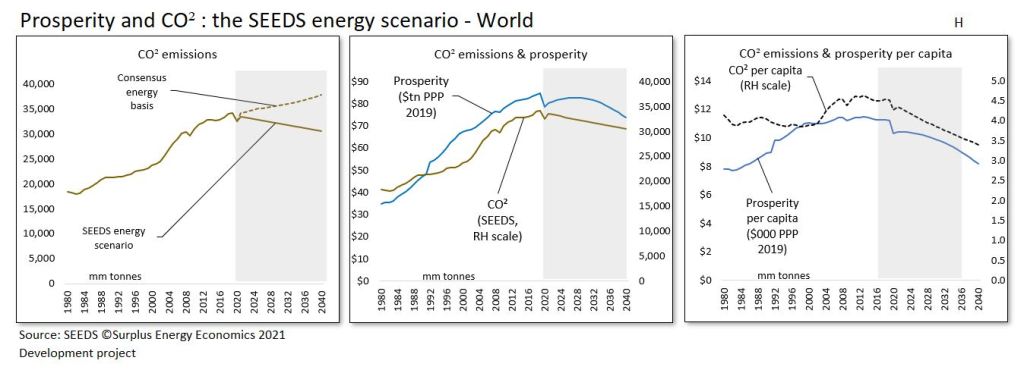
This does at least mean that annual emissions of climate-harming CO² can be expected to decrease. Unfortunately, this welcome trend will be a function, not of a seamless transition to an RE-based economy, but of deteriorating prosperity.

On the SEEDS energy scenario, annual emissions of CO² are likely to fall by 10% between 2019 and 2040, rather than rising by about 11% over that period. This, however, will correspond to a projected decline of 27% in global average prosperity per capita.

Some of the environmental projections that emerge from SEEDS mapping are set out in Fig. H. It need hardly be said that the relationship between the economy and the environment cannot meaningfully be interpreted until energy, rather than money, is placed at the centre of the equation.

Promises of a cleaner future are realisable, then, but assurances of a cleaner future combined with sustained (let alone growing) material prosperity are not.

Fig. H


Economic output

When we note that each dollar of reported economic expansion between 1999 and 2019 was accompanied by the creation of $3 of net new debt – and that GDP “growth” of 3.2% was supported by annual borrowing averaging 9.6% of GDP – we are in a position to appreciate that most (indeed, almost two-thirds) of all reported increases in GDP over the past two decades have been the cosmetic effect of credit and monetary expansion. If credit expansion were ever to cease, rates of growth in GDP would fall to barely 1.0% – and, if we ever tried to roll back prior credit expansion, GDP would fall very sharply.

Stripping out the credit effect enables us to identify a “clean” rate of growth in economic output that turns out to have averaged 1.4% (rather than the reported 3.2%) during the twenty years preceding 2019. As can be seen in Fig. C, the driving of a “wedge” between debt and GDP has inserted a corresponding wedge between GDP itself and its underlying or “clean” (C-GDP) equivalent.

Fig. C


Prosperity

With underlying economic output established, prosperity – both aggregate and per capita – can be identified through the application of trend ECoE. This reflects the fact that ECoE is the component of energy supply which, being consumed in the process of accessing energy, is not available for any other economic purpose. In terms of their relationships with energy, C-GDP corresponds to total energy supply, whilst prosperity corresponds to surplus (ex-ECoE) energy availability. SEEDS identifies the ratio at which energy use converts into economic value, and applies ECoE to establish the relationship between energy consumption and material prosperity.

As well as providing our central economic benchmark, the calibration of prosperity enables us to establish the relationship between material well-being and trends in ECoE. In Western advanced economies, SEEDS analysis shows that prosperity per capita turned down at ECoEs of between 3.5% and 5.0%. In the less complex, less ECoE-sensitive EM countries, the corresponding threshold lies between ECoEs of 8% and 10%.

These relationships, identified by SEEDS, are wholly consistent with what we would expect from a situation in which energy costs are linked directly to the maintenance costs of complex systems.

Illustratively, prosperity per capita in the United States turned down back in 2000, at an ECoE of 4.5% (Fig. D). Chinese prosperity growth appears to have gone into reverse in 2019, at an ECoE of 8.2%, though, had it not been for the coronavirus crisis, the inflection point for China might not have occurred until the point – within the next two or so years – at which the country’s trend ECoE rises to between 8.7% (2021) and 9.1% (2023).

Globally, average prosperity per person has been flat-lining since the early 2000s, but has now turned down in a way that means that the “long plateau” in world material prosperity has ended.

This conclusion is wholly unidentifiable on the conventional, money-only basis of economic interpretation.

Fig. D


Financial

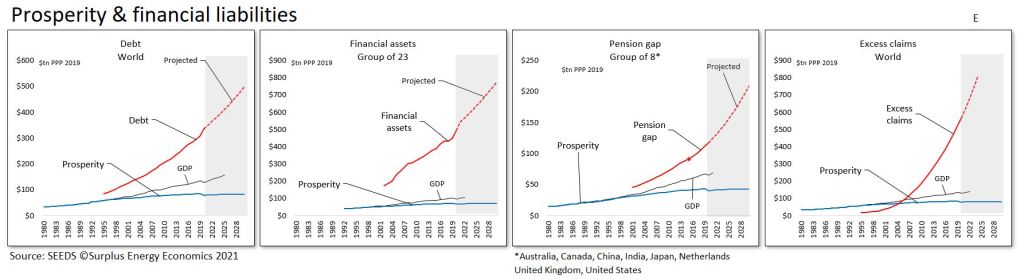
The identification of aggregate prosperity enables us to recalibrate measurement of financial exposure away from the customary (but wholly misleading) denominator of GDP. Four such calibrations are summarised in Fig. E.

Conventional measurement states that world debt rose from 160% to 230% of GDP between 1999 and 2019 – essentially, a real-terms debt increase of 177% was moderated by a near-doubling (+95%) of recorded GDP, leaving the ratio itself higher by only 42% (230/160).

This, though, is a misleading measurement, because it overlooks the fact that GDP was itself pushed up by the breakneck pace of borrowing.

Rebased to aggregate prosperity – which was only 28% higher in 2019 than it had been in 1999 – the ratio of debt-to-output climbed from 168% to 363% over that same period. Preliminary estimates for 2020 suggest that an increase of around 10% in world debt has combined with a 7.4% fall in prosperity to push the ratio up to 430%.

The second measure of financial exposure generated by SEEDS relates prosperity to the totality of financial assets. SEEDS uses data from 23 of the countries for which financial assets information is available, countries which together equate to just over 75% of the world economy.

On this basis, systemic exposure has exploded, from 326% of prosperity in 2002 (when the data series begin) to 620% at the end of 2019. Extraordinarily loose fiscal and monetary policy during 2020 suggests that this ratio may already exceed 730% of prosperity.

Gaps in pension provision are a further useful indicator of financial unsustainability. Back in 2016, the World Economic Forum
calculated pension gaps for a group of eight countries – Australia, Canada, China, India, Japan, the Netherlands, Britain and America – at $67tn, and projected an increase to more $420tn by 2050.

Converting these numbers from 2015 to 2019 values, and then expressing their local equivalents in dollars on the PPP (purchasing power parity) rather than the market basis of exchange rates, puts the number for the end of 2020 at $112 trillion, which equates to 290% of the eight countries’ aggregate prosperity (and 180% of their combined GDPs). Pension gaps are growing at annual rates of close to 6%, a pace that not even credit-fuelled GDP – let alone underlying prosperity – can be expected to match.

The fourth measure of financial exposure produced by SEEDS is specific to the model. As we have seen, monetary systems embody ‘claims’ on a real (energy) economy that has grown far less rapidly than its financial counterpart. This has resulted in the accumulation of very large excess claims.

Calibration of this all-embracing measure, which is known in the model as E4, remains at the development stage. Indicatively, though, it informs us that the world has been piling on financial claims that cannot possibly be met ‘at value’ from the economic prosperity of the future.

From this it can be inferred that a process of systemic ‘claims destruction’ has become inevitable, suggesting that the process known conventionally as ‘value destruction’ cannot now be prevented from happening at a systemically hazardous scale. The most probable process by which this will happen is the degradation of the value of money, meaning that claims can only be met with monetary quantities whose purchasing power is drastically lower than it was at the time that the claims were created.

Measurement of excess claims forms part of a SEEDS national risk matrix which combines purely financial exposure with a number of other factors, one of which is ‘acquiescence risk’. This calculation references growing popular dissatisfaction induced by deteriorating overall and discretionary prosperity.

Fig. E


The individual

The ultimate purpose of economics is, or should be, the measurement, interpretation and (where possible) the betterment of the prosperity of the individual. Situations and projections can be expressed either as an average per capita number, or in amounts weighted to the median on the basis of the distribution of incomes. Average calibration is the primary focus of the model, but a new SEEDS capability (‘FW’) – being developed in response to reader interest in this subject – provides some insights into distributional effects.

As we have seen, the prosperity of the average person has been on a downwards trend in almost all of the Western advanced economies since well before the 2008 GFC. In ‘top-level’ prosperity terms, however, declines thus far have appeared pretty modest, even in the worst-affected countries – in 2019, British citizens were 10.4% poorer than they had been in 2004, with Italians poorer by 10.2% since 2001, and Australians worse off by 10.0% since 2003.

But top-line prosperity, like income, isn’t ‘free and clear’ for the individual to spend as he or she sees fit. Rather, prosperity is subject to prior calls, of which “essentials” are the most significant. Only after these essential outlays have been deducted do we arrive at the average person’s discretionary prosperity, meaning the resources that he or she can use to pay for things that they “want, but do not need”.

Measurement of discretionary prosperity produces rates of decline that are much more pronounced, and are distributed differently between countries, than the equivalent top-line calibrations. British citizens have again fared worst, seeing their discretionary prosperity fall by 32% between 2000 and 2019. The average Spaniard had 26.7% less discretionary prosperity in 2019 than he or she enjoyed back in 1999, whilst the decline in the Netherlands (also since 1999) was 26.5%. This decrease in the value of the discretionary “pound (or dollar, or euro, or yen) in your pocket” correlates directly to rising indebtedness and worsening insecurity, but does so in ways that are not recognised by policy-makers tied to conventional interpretation.

Of course, discretionary consumption has, at least until quite recently, continued to increase, even though discretionary prosperity has fallen. The difference between the two equates to rising per-person shares of government, business and household debt.

Calibration of discretionary prosperity obviously requires measurement of the cost of “essentials”. As mentioned earlier, this is one of the three components of the SEEDS mapping system that are still subject to further development. The conclusions which follow should, therefore, be regarded as indicative.

For our purposes, “essentials” are defined as those things that the individual has to pay for. This means that “essentials” include two components. One of these is household necessities, and the other is government expenditure on public services. These services qualify as “essentials” on the “has to pay for” definition, whatever the individual might happen to think about the services which he or she is obliged to fund. The government component of “essentials” relates only to public services, and does not include transfers (such as pension and welfare payments), which simply move money between people and so wash out to zero at the aggregate or the per capita level of calculation.

SEEDS analyses of prosperity per capita are summarised in Fig. F. In the AE-16 group of advanced economies, taxation (and transfers), being more cyclical, have tended to fluctuate more than spending on public services.

Together, the two components of “essentials” have moved up in real terms, even as prosperity has deteriorated, exerting a tightening squeeze on discretionary prosperity. Because of the credit effects which are interposed between GDP and prosperity, this squeeze cannot – despite its profound commercial, financial and political implications – be identified by conventional interpretation. It can be corroborated, though, by analysis of per capita indebtedness and of broader financial commitments.

As the charts show, relatively modest declines in the overall prosperity of citizens in America, Britain and Japan are leveraged into much sharper falls in their discretionary prosperity.

Fig. F


The median individual

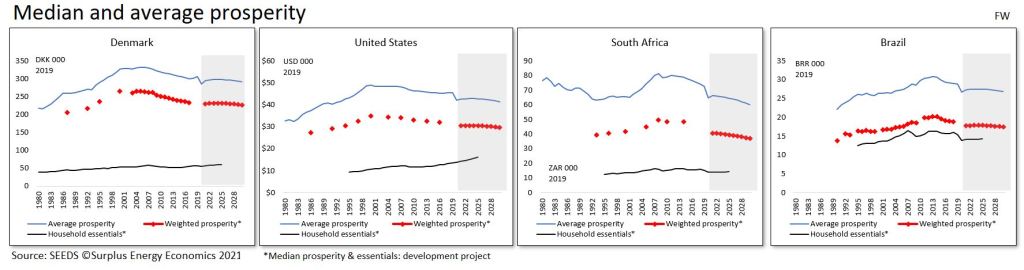
Of course, a country’s ‘average’ person is a somewhat theoretical figure, and one of the remaining SEEDS development projects addresses weighting for the difference between the average and the median person.

Because data for income distribution is intermittent, median prosperity per person is illustrated as dashed red lines in Fig. FW. These charts compare median with average prosperity per capita in four countries, and include the household (but, as yet, not the public services) component of “essentials”.

They show a comfortable margin in comparatively egalitarian Denmark (though the cost of public services in Denmark is relatively high). America remains a “rich” country – albeit less rich than she once was – in which household necessities remain affordable within the prosperity of the median person or household. But the situation in South Africa – and even more so in Brazil – must give rise to considerable concern.

Fig. FW


Business

Obviously enough, the compression being exerted on discretionary prosperity is of great importance to businesses, which are in danger of working to false premises when they rely on the promise of ‘perpetual growth’ provided by orthodox economic interpretation. Companies in discretionary sectors may not realise the extent to which their fortunes are tied to the continuity of credit and monetary expansion.

There are two critical (and related) points of context here. The first is that, as societies become less prosperous, they will also become less complex, rolling back much of the increase in complexity that has accompanied the dramatic economic growth of the Industrial Age. The second is that the proportion of prosperity subject to the prior calls of essentials will rise.

A logical outcome of de-complexification is simplification, both of product ranges and of supply processes. This will be accompanied by de-layering, whereby some functions are eliminated.

Two further factors which can be expected to change the business landscape are falling utilization rates and a loss of critical mass. The former occurs where a decline in volumes increases the per-customer (or unit) equivalent of fixed costs. Efforts to pass on these increased unit costs can be expected to accelerate the decline in customer purchases, creating a downwards spiral.

Critical mass is lost when important components or services cease to be available as suppliers are themselves impacted by simplification and utilization effects. It is important to note that falling utilization rates and a loss of critical mass can be expected to occur in conjunction with each other, combining to introduce a structural component into future declines in prosperity.

These considerations put various aspects of prevalent business models at risk, and this should be considered in the context both of worsening financial stress and of deteriorating consumer prosperity. One model worthy of note is that which prioritizes the signing up of customers over immediate sales. Previously confined largely to mortgages, rents and limited consumer credit, these calls on incomes now extend across a gamut of purchase and service commitments which can be expected to degrade as consumer prosperity erodes. This has implications both for business models based on streams of income and for situations in which forward income streams have been capitalized into traded assets.


Government

The SEEDS database reveals a striking consistency between levels of government revenue and recorded GDP. In the AE-16 group of advanced economies, government revenues seldom varied much from 36-37% of GDP over the period between 1995 and 2019. Accordingly, government revenues have expanded at real rates of about 3.2% annually. We can assume that similar assumptions inform revenue expectations for the future.

As we have seen, though, reported GDP has diverged ever further from prosperity, meaning that there has been a relentless increase in taxation when measured as a proportion of prosperity. In the AE-16 countries, this ratio has risen from 38% in 1995 to 49% in 2019, and is set to hit 55% of prosperity by 2025 based on current trends (see Fig. G4A).

It is reasonable to suppose that, as prosperity deterioration continues, as the leveraged fall in discretionary prosperity worsens, and as indebtedness starts to hit unsustainable levels, the attention of the public is going to focus ever more on economic (prosperity) issues. Politically, this means that what has long been a broad ‘centrist consensus’ over economic and political issues can be expected to fracture.

We can further surmise, either that the ‘Left’ in the political spectrum will revert towards its roots in redistribution and public ownership, and/or that insurgent (‘populist’) groups will campaign on issues largely downplayed by the established ‘Left’ since the ‘dual liberal’ strand emerged as the dominant force in Western government during the 1990s.

In practical terms, governments may need to adapt to a future in which deteriorating prosperity changes the political agenda whilst simultaneously reducing scope for public spending.

A ‘wild card’ in this situation is introduced by the likelihood that the deteriorating economics of energy supply may connect with the ECoE effect on the cost of essentials to create demands for intervention across a gamut of issues. These might include everything from subsidisation (and/or nationalisation) of essential services to control over costs, with energy supply and housing likely to be near the top of the list of demands for government action.

Fig. G4A


Afterword

These considerations on the challenges facing governments bring us to the end of what can only be an overview of the economic situation as presented by the SEEDS mapping project.

What has been set out here is a future, conditioned by energy trends, which is going to diverge ever further from what is anticipated both by decision-makers and by the general public. The view expressed here is that, to shape a better and more harmonious world as the prior drivers of cheap energy and increasing complexity go into reverse, it is a matter of urgency that the real nature of the economy as an energy dynamic should gain the broadest possible recognition.


Monday, November 30, 2020

Climate Links: November 2020

There is no time to lose. Arctic News. Nov. 25, 2020.

Carbon dioxide levels continue at record levels, despite COVID-19 lockdown, the WMO reports. The increase in carbon dioxide from 2018 to 2019 was larger than that observed from 2017 to 2018 and larger than the average annual growth rate over the last decade.

The rise has continued in 2020. The lockdown did cut emissions of many pollutants and greenhouse gases, but any impact on carbon dioxide levels - the result of cumulative past and current emissions - is in fact no bigger than the normal year to year fluctuations. 

“Carbon dioxide remains in the atmosphere for centuries and in the ocean for even longer. The last time the Earth experienced a comparable concentration of CO₂ was 3-5 million years ago, when the temperature was 2-3°C warmer and sea level was 10-20 meters higher than now. But there weren’t 7.7 billion inhabitants,” said WMO Secretary-General Professor Petteri Taalas.


Accelerated global warming and stadial cooling events: IPCC oversights regarding future climate trends. Andrew Glikson, via Arctic News. Nov. 16, 2020.

The linear nature of global warming projections by the IPCC (2014) Assessment Report (AR5) (Figure 1) appears to take little account of stadial cooling events, such as have followed peak temperature rises in previous interglacial stages. The linear trends appear to take only limited account of amplifying positive feedback effects of the warming from land and ocean. A number of factors cast doubt on IPCC climate change projections to 2100 AD and 2300 AD, including:


However, global temperature measurements for 2015-2020 indicate accelerated warming due to both the greenhouse effect reinforced by a solar radiation maximum (Hansen and Sato 2020) (Figure 2).

The weakening of the northern Jet stream, due to polar warming and thus reduced longitudinal temperature contrasts, allows penetration of warm air masses into the polar region and consequent fires (Figure 3). The clash between tropical and polar air and water masses (Figure 3A) leads to regional storminess and contrasting climate change trajectories in different parts of the Earth, in particular along land-ocean boundaries and island chains.

The weakening of the jet stream and migration of climate zones constitute manifestations of an evolving Earth’s energy imbalance¹, namely a decrease in reflection of solar radiation from Earth to space and thereby global warming. Earth retained 0.6 Watt/m² during 2005-2010 and 0.87 Watt/m² during 2010-2020 (Hansen and Sato 2020), primarily due to a rise in greenhouse gases but also due to a solar radiation peak. During 2015-2020 global warming rates exceeded the 1970-2015 warming rate of 0.18°C/per decade, a deviation greater than climate variability. Hansen and Sato (2020) conclude the accelerated warming is caused by an increasing global climate forcing, specifically by the role of atmospheric aerosols.

....

The consequences for future climate change trends include:
  • Further expansion of the tropical climate zones and a polar-ward shift of intermediate climate zones, leading to encroachment of subtropical deserts over fertile Mediterranean zones.
  • Spates of regional to continent-scale fires, including in Brazil, Siberia, California, around the Mediterranean, Australia.
  • A weakened undulating jet stream (Figure 3) allowing penetration of and clashes between warm and cold air and water masses, with ensuing storms.
  • In Australia the prolonged drought, low vegetation moisture, high temperatures and warm winds emanating from the northern Indian Ocean and from the inland, rendering large parts of the continent tinder dry and creating severe fire weather subject to ignition by lightning.
  • The delayed melting of the large ice sheets due to hysteresis², would be followed by sea level rise to Pliocene levels, ~25 meters above pre-industrial levels, once sea level reaches equilibrium with temperature of 2 to 3 degrees Celsius or higher, changing the geography of the continents.


Abstract
The risk of points-of-no-return, which, once surpassed lock the world into new dynamics, have been discussed for decades. Recently, there have been warnings that some of these tipping points are coming closer and are too dangerous to be disregarded. In this paper we report that in the ESCIMO climate model the world is already past a point-of-no-return for global warming. In ESCIMO we observe self-sustained melting of the permafrost for hundreds of years, even if global society stops all emissions of man-made GHGs immediately. We encourage other model builders to explore our discovery in their (bigger) models, and report on their findings. The melting (in ESCIMO) is the result of a continuing self-sustained rise in the global temperature. This warming is the combined effect of three physical processes: (1) declining surface albedo (driven by melting of the Arctic ice cover), (2) increasing amounts of water vapour in the atmosphere (driven by higher temperatures), and (3) changes in the concentrations of the GHG in the atmosphere (driven by the absorption of CO2 in biomass and oceans, and emission of carbon (CH4 and CO2) from melting permafrost). This self-sustained, in the sense of no further GHG emissions, melting process (in ESCIMO) is a causally determined, physical process that evolves over time. It starts with the man-made warming up to the 1950s, leading to a rise in the amount of water vapour in the atmosphere-further lifting the temperature, causing increasing release of carbon from melting permafrost, and simultaneously a decline in the surface albedo as the ice and snow covers melts. To stop the self-sustained warming in ESCIMO, enormous amounts of CO2 have to be extracted from the atmosphere.


No Matter Who Wins. Nate Hagens. Nov. 1, 2020.

Modern elections—despite their social and political importance—have become more like sporting events than referendums around ideas. We so intensely identify with our partisan tribe, that we focus on the slogans, the rooting against the ‘other guy’ and other us-vs-them dynamics, and often lose sight of the issues, the context, and how ‘winning’ for our country (and world) might actually be influenced by our choices.

We are inherently tribal, after all. Of all of our inherited ancestral heuristics, defending our (historically small) tribe and ostracizing/rooting against the other tribe is one of the strongest human universals. In fact, perhaps humans’ best quality – cooperation and collaboration – was a byproduct of the strong unity born out of common threats, accessing surplus, and tribal warfare. We cooperate – for the good of our group – and for tens/hundreds of thousands of years, this meant survival.

Fast forward to November 2020, USA and the four year inflection point where half the country is rooting for Joe Biden and the other half (roughly) for Donald Trump – in our minds we know this election is an important guidepost for our collective future, but we approach this week with similar temperament and behavior as a Packer/Viking pre-game tailgate.

We are now in the liminal space between our nation’s long history and uncertain future. Facts and expertise matter less by the day. Emotions and tribal affiliations rivet our attention on the ‘cars’ instead of focusing at the road ahead of us. Later this week 50% of our population will be elated and the other 50% will be angry. And most of both camps will be variously: righteous, anxious and uncertain, and perhaps violent. This, along with the various trivia of Democrat and Republican victories and defeats will be the hyper-focus of our media. But below, in no particular order, is a look at some of the critical guideposts of the next 4 years along the winding road of our collective future that – as colleagues, citizens and neighbors in the United States of America, we’ll have to navigate with each other – no matter who wins the election.


COVID 19- Spilling into 2021

As I wrote in March, the ‘cure’ (lockdowns) for COVID would be worse than the disease in aggregate impact. Though death rates were perhaps overblown, the virulence -and ‘long COVID complications’ were not. Various vaccines and treatments and protocols will be developed but the worst months may still be ahead of us. This virus may or may not ultimately have a cure, but either way COVID has permanently redirected the vascular system of the human superorganism, explained below. No matter who wins the election, the Coronavirus will still be with us. And we’ll have to respond in creative ways.


V vs K

Economies tanked in the 2nd quarter and – on the backs of stimulus and central bank support – roared back in Q3. Through July 31, 2020 -when direct stimulus ran out – the US government was responsible for fully 25% of our national wages. While the professional class (and tech companies) are experiencing a sharp V recovery, many hourly workers, small businesses, retail, leisure, transportation, restaurants are seriously struggling. Many people are hanging on via donations and loans from friends and family and ‘food insecurity’ is becoming widespread. The conventional thinking is that in either a Democratic or Republican ‘sweep’, considerably more stimulus (aka borrowing from future to consume today) will arrive. If, there is e.g. a Biden win and the Senate stays Republican, continued government stabilization of the economic patient will be in jeopardy, and many systemic risks ensue.

But headline GDP statistics aside, the pandemic has widened already large disparities between the haves and have nots. The COVID recession is the most unequal one in US history. As we recover – or don’t – distribution of resources within our population is going to be a critical issue – (more on this below). At some point if the have nots have nothing, they may be forced to take from the haves – or do without. No matter who wins the election we are going to have to find ways to support the weak, the vulnerable and the unemployed. And I expect these will number in the 10s of millions.


Ideology, Memes and Icebergs


If you haven’t been asleep, traveling or drugged these past few years, you’re aware there is a growing movement pointing out the racial, social and economic injustices of our current system. This is in large part because there are considerable racial, social and economic injustices in our current system. But fairness was never the objective built into our cultural goals or institutions – we optimize for (economic) efficiency, not fairness, nor for resilience. The situation is this: various demographics now quite vocally (and reasonably) want a larger share of the economic pie, but the pie itself is about to shrink, which is something few are aware of – and don’t like to hear/think about.

Let’s unpack this using an overused analogy – the Titanic. On the Titanic were 3 classes of passengers – First Class, Second Class and Steerage (or 3rd Class). You can imagine the conversations, hopes, dreams and concerns of the various people on that ship over a century ago. And, history tells us that the tragedy did not befall each class equally – 39% of 1st class passengers perished, 58% of 2nd class and 76% of steerage passengers drowned. The same demographics exist today and are probably having similar conversations within and between groups, focused on maintaining status, moving up in class, or demanding better conditions.

And then there is someone like me – shouting (to all 3 classes) that we just hit an iceberg and need to use science, discourse, reason and planning to find the best solution to navigating evacuation, lifeboats and a new course. You can imagine the reaction – indeed you see it in the news and in your town hall meetings. The ‘first class passengers’ publicly decry that there is no iceberg that technology would never allow the ship to hit an iceberg let alone sink (but privately they are looking to ‘lifeboats’ aka gated communities and the like). The second class passengers are scrambling like mad to ingratiate themselves to the first class passengers to get crumbs of surplus lest they slip into steerage. And the steerage passengers – a full 50%+ of American society today have 2 common responses: 1) “Ok sure there may be an iceberg, but we need to solve our more immediate concerns like our current unacceptable living/working conditions, because we’ll drown from those before any freaking iceberg” (they have valid points) or 2) “Ya right, an iceberg -that is just another story by elites and governments telling us what we have to do and taking away our rights and freedoms”. The difference now (vs on the actual Titanic) is that the steerage class (economically) houses both the far left and the far right, effectively creating additional ‘iceberg’ conditions within the ship itself. The people in ‘steerage’ can’t easily process that in addition to their current challenges, society ALSO has hit an iceberg (see below).

The point here is that the narratives (and religions) that make people feel good are often not based on reality. Which makes discussing, planning and responding to ‘the iceberg of the 2020s’ a very difficult task. The key will be to acknowledge the moral failings of our economic and cultural past while simultaneously acknowledging and planning the lifeboat situation. That’s a difficult thing for a human mind to do.

No matter who wins the election we will be faced with multiple non-overlapping memes and explanations for the upheaval that is coming. Our plight is biophysical (biology and physics) in nature but will be blamed on class, race, politics, and ideology. Navigating this is going to be exceedingly difficult. A new captain can change the morale and surround himself by great minds to make the best civic decisions, but he/she cannot change the fact that our economy and culture has hit an iceberg.


The Zombies are Coming

The central bank purchases and guarantees of various offerings of debt has turned the financial system into a digital Rube Goldberg machine. One of the externalities is that – while the economy was suffering from an exogenous shock from COVID – public companies used the FED bond guarantees to raise cheap debt. For instance, Boeing – a company who arguably will come out of the COVID crisis with worse business prospects due to less demand for planes – nearly doubled its long term debt because it could do so at low rates (the bonds being guaranteed by the FED). This means Boeing – and many other companies – will emerge from this crisis with both lower revenues and higher debt loads, putting them at risk of becoming ‘zombies’. Zombie companies are those whose profits are not enough to pay their interest payments – and they need to take on even more debt (or get direct aid from governments) to stay solvent.

Yes – it’s true stock markets are near all time highs. But this too is a distribution (and expectation) problem. Going into Q3 earnings, the five largest S&P 500 stocks (AAPL, MSFT, AMZN, GOOGL, FB) were expected to grow 3Q sales and EPS by +13% and +1% while the other 495 stocks in SP500 are expected to have a -5% revenue drop and a -24% drop in EPS.

Some great companies. Lots of zombies. No matter who wins this election, we (and the rest of developed world) are going to face a large and growing number of bankrupt and insolvent companies. Stimulus will help – and is critically necessary – but isn’t a long-term solution. And, as the government takes on more and more of this burden, it too risks zombification.


A Cul-de-Sac – and Full of Cans


At year end 2019 we were still recovering from the Great Recession -the ‘temporary’ measures initiated in 2008 – artificially low interest rates, too big to fail guarantees, Quantitative Easing, explosion of government debt, expansion of central bank balance sheets, etc. are still in effect a dozen years later. Even with all this, productivity gains have been tiny – and a fraction of earlier decades.

Now, in addition to all this, governments are adding fiscal stimulus – because they must. The little green man behind the curtain – (currently Jerome Powell) is a very capable and good person but he is not superman. The institution he oversees - the Federal Reserve – is using a giant, and mostly invisible, magic wand to beam what we might’ve consumed in 2030 or 2040 forward to 2020 (in the process leaving less available in 2030 and 2040). Modern Monetary Theory tells us deficits don’t matter – but from a biophysical lens they do – when we create money, we do not create the energy and materials needed to pay it back, so adding more and more debt becomes less productive over time – and has limits, both for companies, for nations, and for economic systems.

What happens when either the government decides to stop stimulus (hard to imagine) or the bond market says ‘no mas’ via higher rates? What is the plan by either the Left or the Right (or anyone) for when QE and stimulus combined cannot plug the economic hole for people and businesses? My opinion is that this question will be answered before 2025 – and the answer will be a drop in GDP akin to the 1930s. Yes, more debt and creative stimulus/infrastructure spending will forestall this for a while, but we will soon face a situation when we can no longer kick the can of growing GDP again to the future. COVID is but a foreshadowing. Money isn’t reality – it’s a marker for the things that matter: built, social, natural and human capital. No matter who wins the election we have a 50+ year physical/financial bill that’s coming due.


Our Basement Larder, is -Unbeknown to Most – Going Bare


(Charts from Labyrinth Consulting. Assumptions: EIA & Enverus data through August 2020. Sept and Oct guided by EIA tight oil estimates plus Labyrinth estimates for OCS & conventional. Nov 2020 thru Nov 2021 calibrated speculation using to-date tight oil rig count and production correlation extrapolating 2020 ratio average for deep water & conventional production.)


If you took a poll and asked people what the single biggest casualty was from the pandemic, very few people would respond with ‘oil’. But no matter who wins the election, US oil production, including shale oil, is about to fall off a cliff, with massive consequences for society. For the setup of our modern way of life, oil is effectively our hemoglobin – and the COVID arrow hit at the heart of the industry as market prices are far below what it costs to extract oil from the ground. Yet this is all invisible to most people as the media (and economics departments) still conflate price with cost and cost with value. We were in bad shape BEFORE Covid-19 and now the Red Queen (drilling faster and faster just to maintain static production) has stepped off the treadmill for 6+months – meaning the large underlying decline rates of existing fields are not being offset much by new drilling. Worse, most of the recent decline in production is because wells have been shut in. Many of these will never be brought back on line because they cannot meet basic operating expenses and production taxes at current oil prices. In aggregate, US production is so far down -2.28 mmbpd from a 2019 monthly average high of of 12.86 mmbpd. Assuming rig counts and prices stay roughly where they are (and with no stimulus they may get worse), this implies a level of about 7 mmbpd by late summer 2021 – nearly a 50% drop. Globally, the reduction in travel, leisure and transport due to COVID effectively squeezed upstream investment- we are down to 72.8 mb of crude and condensate from 84.6 in November 2018, -which date is highly likely to be the all time peak in global production. Note: this will likely never be recognized as such because there will always be a non-biophysical reason articulated as to why we aren’t getting more oil. E.g. ‘the chinese’ or ‘the environmentalists’ or ‘the war’.)

To label this geologic phenomenon as ‘peak demand for oil’ is the economic equivalent of saying the reindeer on St Matthew Island faced ‘peak demand for lichen’. Oil is the lifeblood of our (current) economy -peak demand for oil also likely means peak growth for economies (unless massive efficiencies and fuel switching occur very fast). We probably won’t notice any lack of oil for many years because affordability by citizens will likely decline faster than oil itself (unless massive stimulus and central bank bazookas arrive). Regardless an accelerated retiring of the fossil armies that do most of our work, and create and deliver our modern smorgasbord of goods and services is now on the horizon.

(Note: I think the graph from my friend Art may be a bit pessimistic, but maybe not. We face a biophysical gauntlet where the price citizens can afford is getting lower and lower and the price energy companies need is higher and higher. If governments guarantee high prices to oil companies, or there are other incentives, production might be higher than indicated here – but here is a glaring statistic – if we were to stop drilling in USA entirely we would lose around 40% of our entire oil production in 1 year – we have to keep investing/drilling in more difficult and costly spots to avoid such a decline. (the 1 year decline rates are: Texas 40%, ND is 52%, Oklahoma 50%, GOM/deepwater 32% New Mexico 45% – these 5 regions are 80% of US production).

This is not remotely being discussed in our culture.

No matter who wins the election, US oil production has peaked – again - and this time including the tight oil provinces – from the ‘source rock’. This will have….large long term consequences, whether one is left, right or libertarian.


Complexity


Increasingly I think it’s neither oil nor finance, nor social disruption that is our core risk but declining returns to complexity

Historian Joseph Tainter famously studied how ancient civilizations declined due to the inability of resources/productivity to keep pace with complexity. In today’s world, this can be seen in myriad ways, from the unemployment software in US States being written in COBOL and FORTRAN, to APIs for majority of our medicines made in India and China, to the paint for a Ford truck only made in Fukushima, Japan.

It’s not something we think about, but we all are part of a complex global supply chain. On the way up, using the concept of ‘comparative advantage’ our society outsourced various manufacturing to countries of the lowest cost production – which in many cases meant locations in Asia with cheap labor. COVID gave us a glimpse of the dangerous underbelly of those decades old decisions: almost 200 drugs currently listed as in short supply by FDA, 6 month wait for bicycles, heavy equipment delays etc. This is a separate issue from short term kinks in the supply chain for e.g. ammunition, canned goods, and toilet paper etc. This issue goes to the embedded fragility of a global system based on growth by perpetually relying on import substitution models of production.

No matter who wins the election, with the geopolitical context that is COVID 19 on financial steroids, making sure that important things are made domestically (or regionally) may become an important question.


Other Energy


Humans – during periods of growth – and contraction – self-organize around energy. Oil is central but our entire energy balance sheet is going to be a critical issue in the coming decade. Under a Biden win, various Green New Deal proposals will lead to a massive increase in scale for renewable energy. In many ways this is good news, because it will be good for GDP, it will create jobs, and grow our supply of low carbon energy. But the key problem with what’s coming is the goal is ‘lower carbon energy’ not ‘systemically addressing human futures’. 

Briefly: 1) renewable energy isn’t renewable, it’s rebuildable and requires vast amounts of non-energy materials, minerals and land 2) only ~20% of (current) energy mix is electricity which is the type of energy produced from most renewables 3) the higher % of RE in our mix the more important back up (NG and coal) will become – and the US is facing an impending gas shortage as US drilling has plummeted. (the largest growth component of supply was the associated gas from tight oil production), 4) the cost of RE isn’t merely adding some solar panels or wind turbines but the full system cost of integrating RE into the grid which will be higher than consumers currently pay, which will weigh on a fragile economy 5) all RE blueprints expect a LARGER economy in the future when (see above) most realistic scenarios using systemic analysis (finance, politics, biophysical inputs) point to a smaller economy.

Still, renewables are our only hope – they are mature, robust and inexpensive vis-à-vis even a decade ago. The problem will be how to ‘increase renewables to a smaller and more complex system’. No matter who wins the election, we will have to face a more complex and less dependable energy future.


Meaning and Well-being


One of the silver linings (if you will) of the pandemic is that now a great number of people are personally aware that US GDP/ 330 million does not represent how well we are doing as individuals or as a nation. The constant media reminders that the SP500 and Dow Jones just made all-time highs is incongruous with most peoples real lived experience (and most of whom have zero money in the stock market). Whether one understands or agrees with the risks of climate change, energy depletion or limits to growth, tens of millions of people are now hungry for living a decent life with access to basic needs, while doing something good and meaningful. The coming decades – by definition but also by desire – are going to be more about well-being than they are about growing our consumption of stuff.

No matter who wins the election, our nation needs to embark on a deep conversation about what our cultural goal is – we are going to need complementary metrics to the econometric measures quantifying how much energy we burned. What is all this energy for is a question that should be part of our national discourse.


Protecting Heaven


Lost in the discussions of Republicans vs Democrats, stimulus, PPP, COVID statistics, stock market gyrations and geopolitics is perhaps the most important story of all – the state of Earth’s ecosystems and the ~10 million species we share the planet with. They are ‘downstream’ of our elections and financial/economic systems, but none of them have a vote.

I have concluded that natural systems and species futures – for better or worse – are linked to human futures – we have to ‘bend not break’ to have the best outcome for (most) Earth Systems (other than perhaps oceans and very remote species). I believe humans are not any better or worse than we were 100 years, 1000 years or 100,000 years ago – there are just more of us so our impact is (much) larger and each and every one of us consuming much more resources than our ancestors did. Humans are good at heart but we are biological organisms following cultural goals that have expiry dates. We have arrived at a ‘species level’ juncture and need to use systems science, reason, discourse, and leadership to navigate a glide path to intact futures.

No matter who wins the election, the state of the natural world needs to be included in our plans and discussions. Unfortunately, it first needs to be included in our values.


Joy, Living, and Goals


The Great Depression, unless you lived in a big city, mostly happened in slow motion. Similarly, unless we’re very unlucky, the events of the coming decade will unfold gradually. We have to take it upon ourselves to civically engage, but also find time to enjoy and appreciate our lives – being alive at this amazing and perilous time.

We all have ‘conditional’ goals, those which rely on something external to us to change in order to succeed. Many of those goals will not get met because external conditions prevent them – perhaps the ‘guy who we didn’t vote for’ winning the election. The key is to also find “unconditional” goals – those which we ourselves can be 100% responsible for. That way we can feel more empowered to reach those goals, which many times can influence the conditional goals in positive ways. Growing food, spending time with your neighbors, learning a new (useful to the future) skill, mutual aid, etc. The key for all of us – is to meet the future halfway.

No matter who wins the election, life, and the opportunity for joy, impact, and meaning will exist, perhaps even more so.


The 2020 Election and beyond


So, dear reader and fellow countrymen/women, go vote. But voting is merely the beginning of our civic duty. Our country will be shaped by how we citizens respond to the challenges ahead of us as much (or more) than it will by which party wins the election. What am I rooting for? Rationality, science, civility, discourse, which opens up other potential pathways. Our culture is capable of much more than guns, germs and steel or being an energy dissipating superorganism.

People who practice common decency and respect are by far the majority in our (and other) countries. When matched with perseverance, common goals and prioritizing social capital and relationships, we might just happen upon the glide path to decent futures. There are 10s of millions of Americans craving having their basic needs met and just doing some good with their lives – they just don’t yet have a roadmap and convening place. Could such a thing be the emergent result of the 2020 election?

Society right now is dancing – and fighting on the roof of an A-frame with the winds blowing hard and a storm shooting lightning at our heads. We need to keep dancing (less fighting) while we climb down to more stable ground.

No matter who wins the election this week we are on the cusp of major change which will require both top-down and bottom up interventions and cultural emergence. I hope you can play a role.


The objective economy, part one. Tim Morgan, Surplus Energy Economics. Nov. 12, 2020